

Sometimes, a single slide can explain more than a long report. Points and Figures is our way of breaking down what India’s leading companies are telling their shareholders and analysts. We comb through the decks, pull out the charts and data points that actually matter, and highlight the signals behind the numbers—whether about growth plans, margins, new markets, or risks on the horizon.
This is an extension of The Chatter. While The Chatter focuses on management commentary and earnings call transcripts, Points and Figures dives into investor presentations—and soon, even annual reports—to decode what companies are showing, not just what they’re saying.
We go through every major investor presentation so you don’t have to—bringing you the sharpest takeaways that reveal not just what the company is saying, but what it really means for the business, its sector, and the broader economy.
In this edition, we have covered 18 companies across 10 industries.
Financial Services
Power Finance Corporation (PFC)
Rural Electrification Corporation Limited (REC)
Indian Renewable Energy Development Agency Limited (IREDA)
HUDCO
Multi Commodity Exchange
Chola Invest & Fin.
Chemicals
Neogen Chemicals
Engineering & Capital Goods
Jyoti CNC Automation
Graphite India
Energy
Deep Industries
Plastic Pipes
Kriti Industries (India)
Auto Ancillary
Ather Energy
Retail
Trent
Swiggy
Metals
Hindalco
FMCG
Britannia Inds
Healthcare
Aarti Drugs
Apollo Hospital Ent.
Financial Services
Power Finance Corporation (PFC) | Large Cap | Financial Services
Power Finance Corporation (PFC) was incorporated on July 16, 1986 and is a Schedule-A Navratna CPSE, and is a leading Non-Banking Financial Corporation in the Country. The company is engaged in providing financial assistance to Power Utilities for meeting financing and development requirements of the power sector. To meet its fund requirement, PFC has been raising the funds by way of issuance of bonds, term loans from Banks/FIs and ECBs etc.
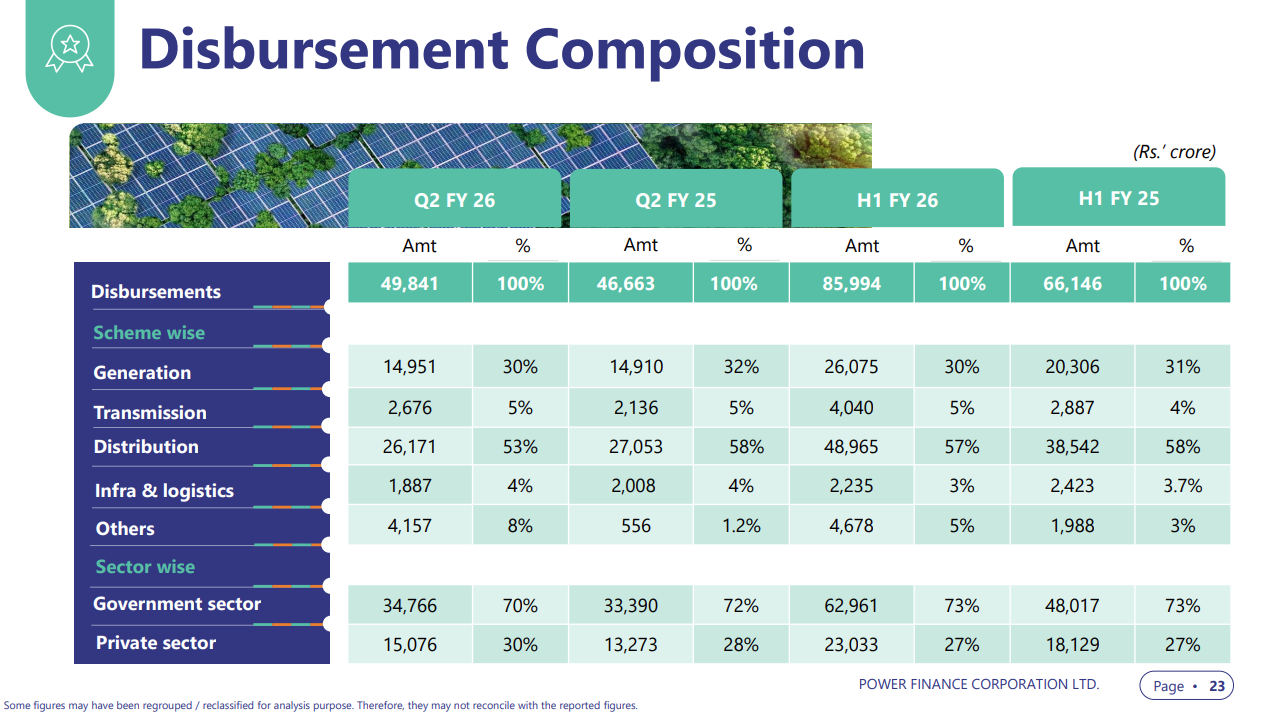
Power Finance Corporation’s disbursements continue to be dominated by the distribution and generation segments, which together form over 85% of lending. Government entities remain the primary borrowers, accounting for nearly 70–73% of total disbursements, underscoring PFC’s central role in funding India’s power sector expansion.
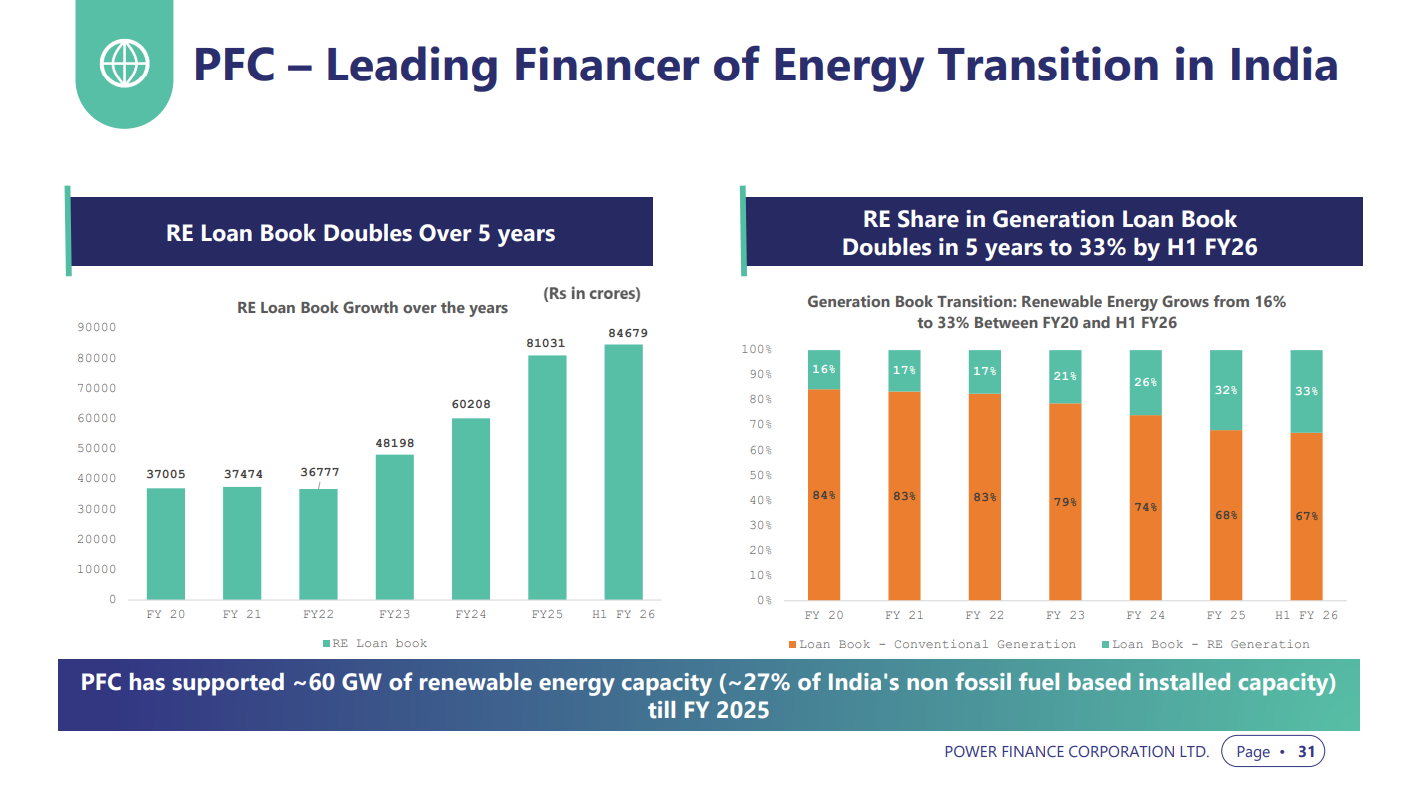
PFC’s renewable energy push is gathering pace — its RE loan book has more than doubled in five years to ₹84,700 crore, with renewables now making up a third of its generation portfolio. The lender has financed around 60 GW of clean capacity, cementing its role as a key enabler of India’s energy transition.
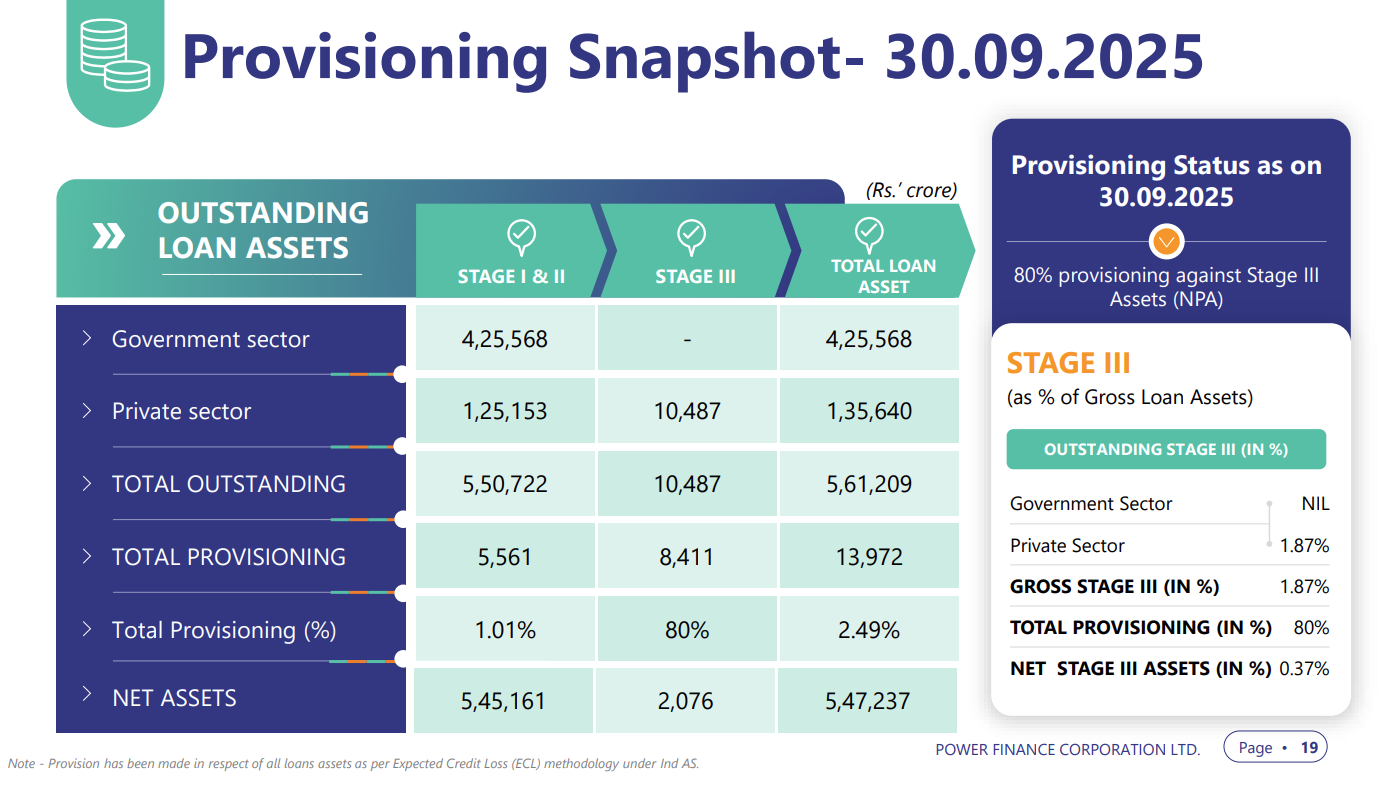
PFC’s loan book remains remarkably resilient — with no government sector exposure in Stage III (NPA) and overall stressed assets limited to 1.87% of total loans, entirely within the private sector. With 80% provisioning already made, the company’s asset quality remains among the strongest in the financial sector.
Rural Electrification Corporation Ltd (REC) | Large Cap | Financial Services
Rural Electrification Corporation Limited (REC) offers long-term loans and financing products to State, Centre, and Private Companies for infrastructure asset creation. They provide financial services across the power sector value chain, addressing the needs of state power utilities, private developers, central power sector utilities, and state governments for power generation and system improvement initiatives.
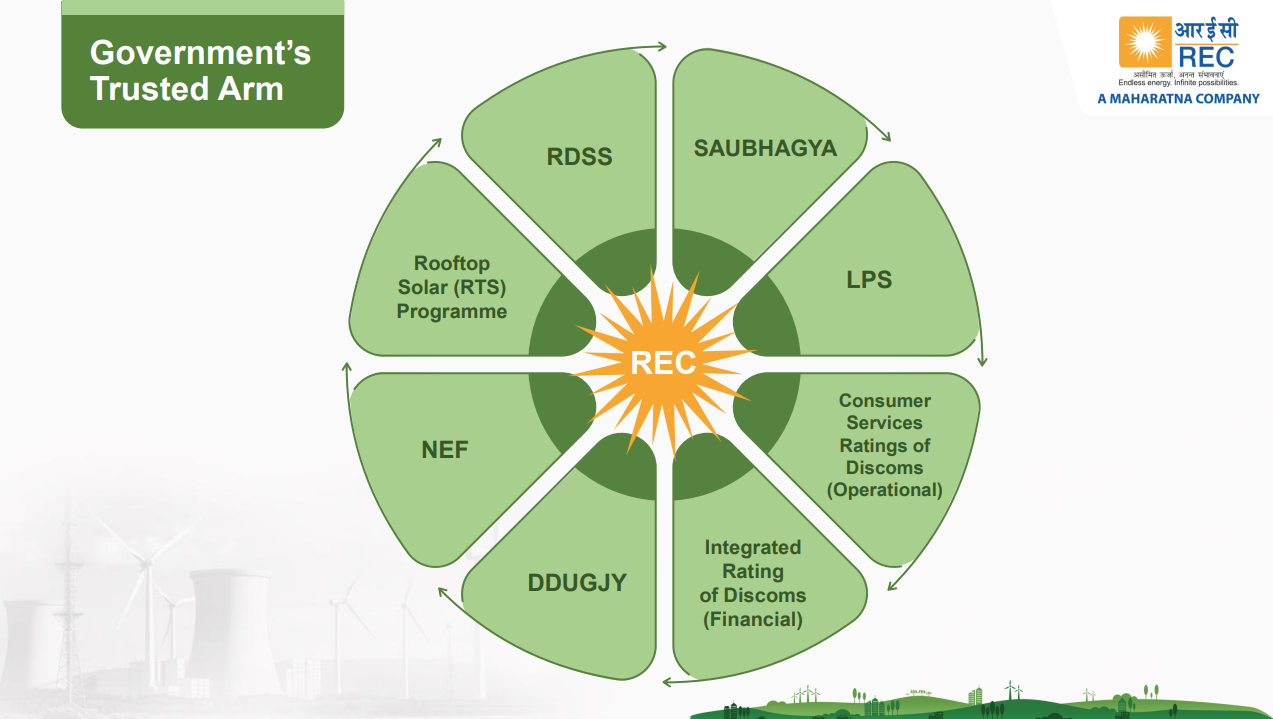
Many of India’s flagship power and electrification schemes are channelled through REC, the government’s key implementing and financing arm. From rural electrification (DDUGJY) and solar rooftops to distribution reforms (RDSS) and discom ratings, REC acts as the backbone of India’s power infrastructure development and energy transition efforts.
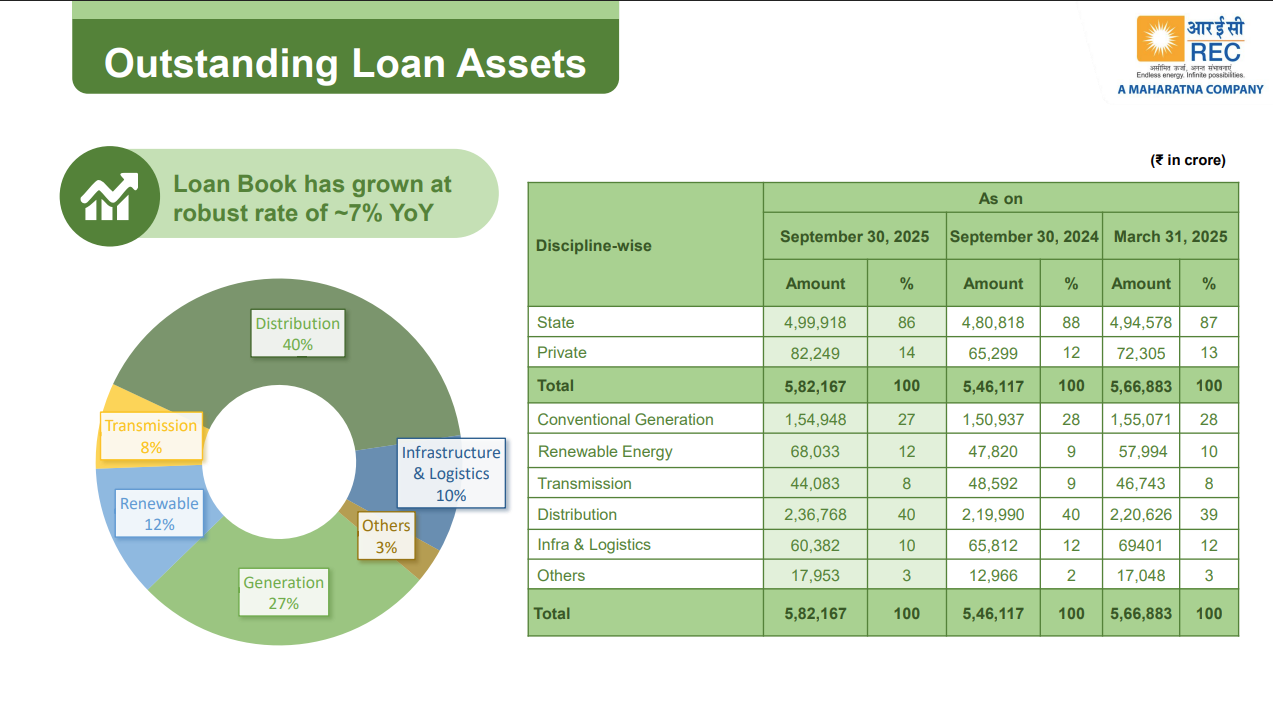
REC’s loan book continues to expand steadily — up ~7% year-on-year to ₹5.8 lakh crore — with a balanced mix across distribution (40%), generation (27%), and renewables (12%). The bulk of lending remains to state utilities, underscoring REC’s core role in powering India’s public-sector-led energy growth.
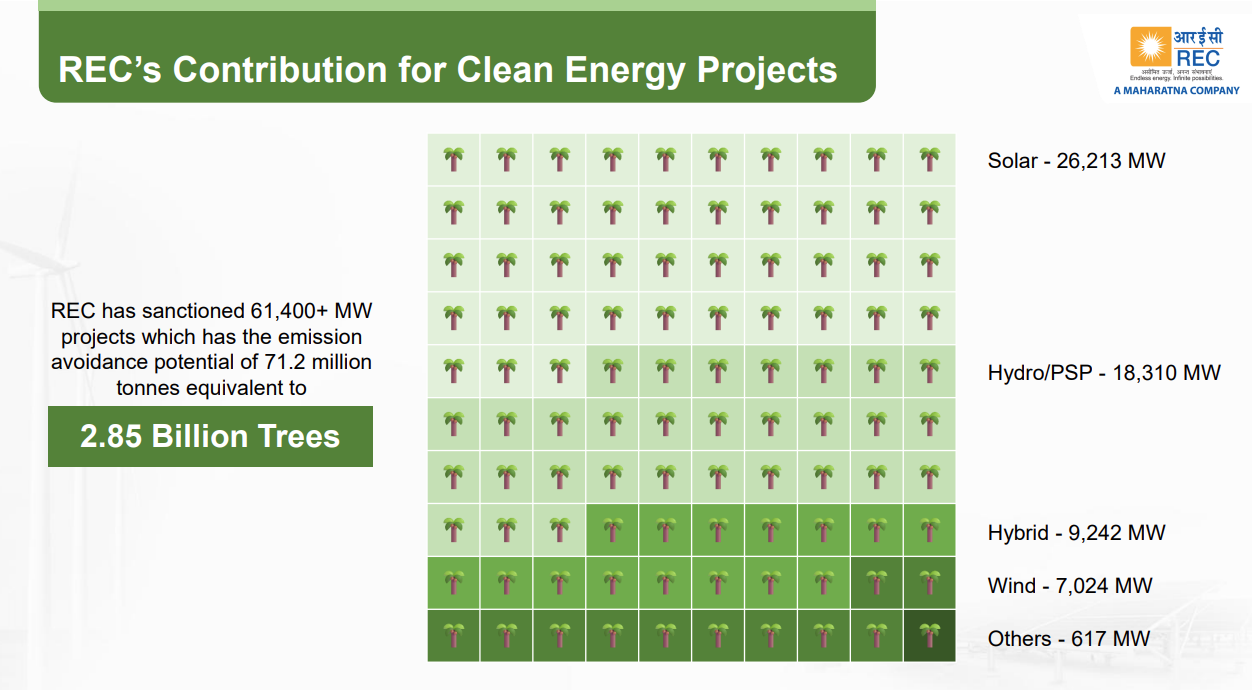
REC is emerging as a major clean energy financier — having sanctioned over 61 GW of renewable projects spanning solar, hydro, wind, and hybrid sources. These projects together offset emissions equal to 71 million tonnes of CO₂, the same as planting 2.85 billion trees.
Indian Renewable Energy Development Agency Limited (IREDA) | Mid Cap | Financial Services
Indian Renewable Energy Development Agency Limited (IREDA) is a Government of India Enterprise under the Ministry of New and Renewable Energy. Established in 1987, IREDA is a non-banking financial institution that provides financial assistance for projects related to renewable energy and energy efficiency with the motto ‘Energy For Ever.’
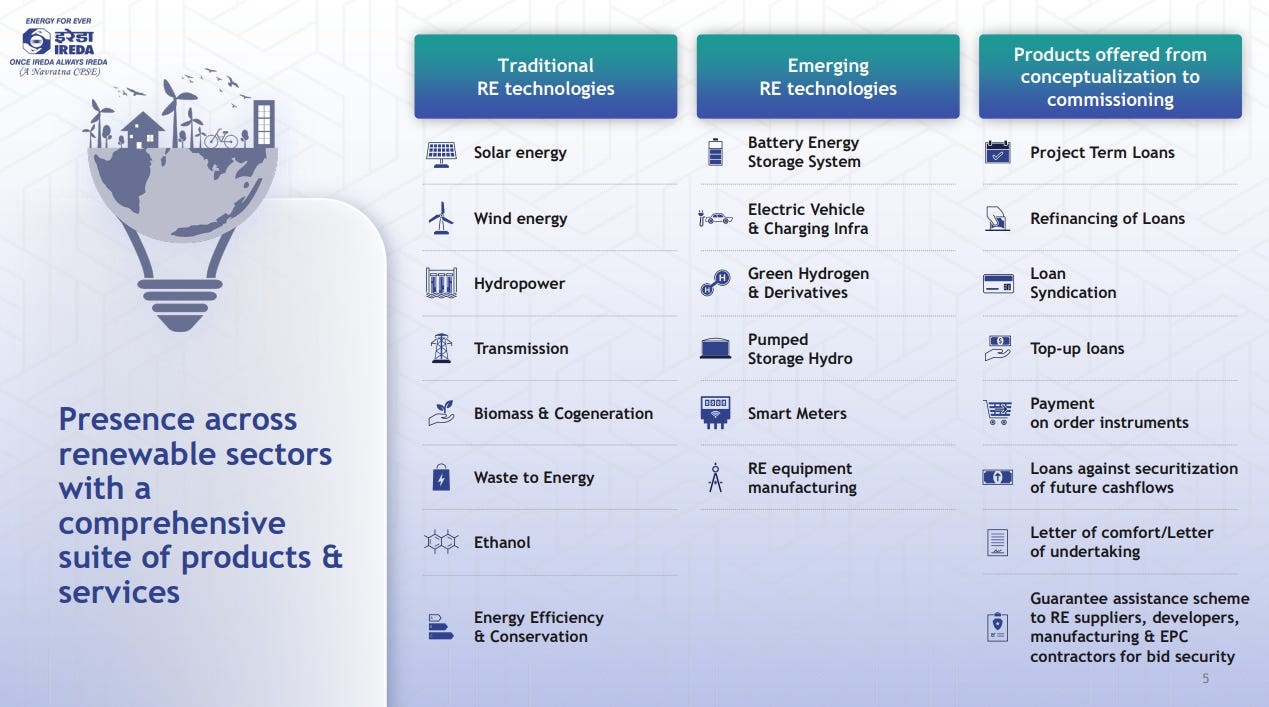
IREDA plays a pivotal role in financing India’s clean energy transition — supporting everything from traditional renewables like solar and wind to emerging sectors such as green hydrogen, EV charging, and energy storage. Its wide product suite covers the entire project lifecycle, from concept to commissioning.
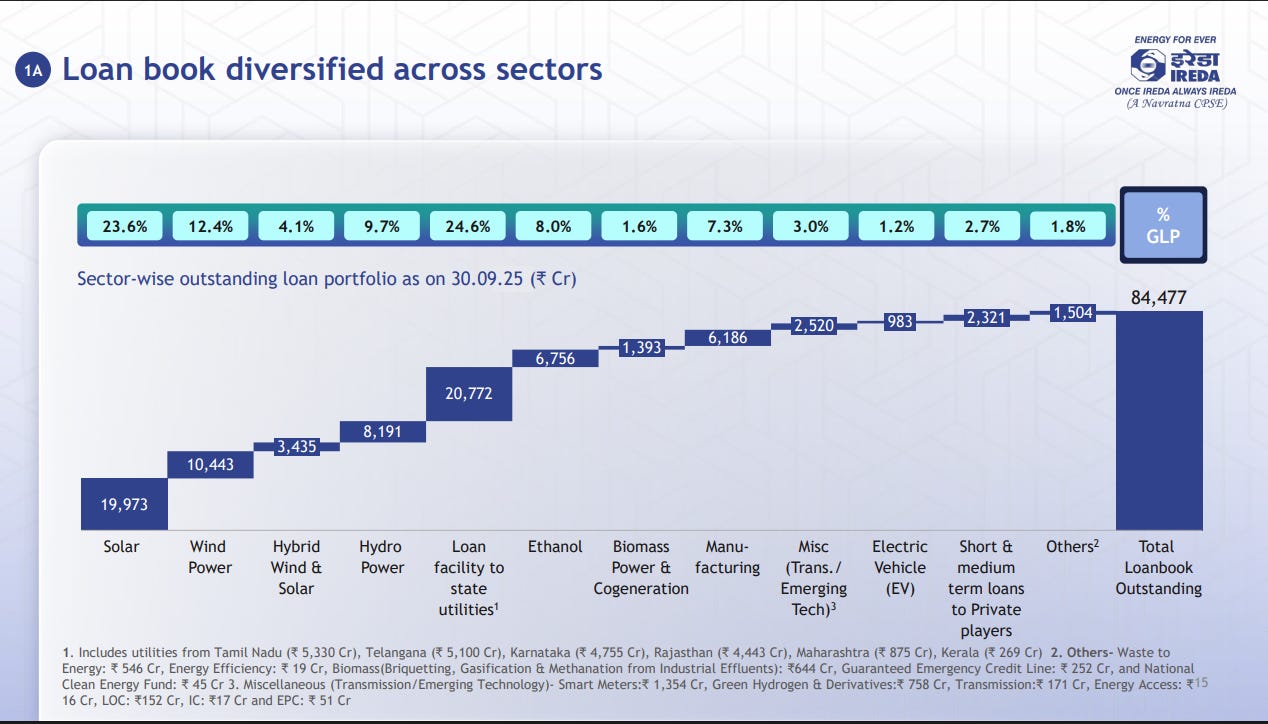
IREDA’s ₹84,000+ crore loan book is well spread across clean energy sectors — led by state utility financing (25%), solar (24%), and wind (12%). The diversification across ethanol, EVs, biomass, and emerging technologies underscores its expanding role as India’s dedicated green financier.
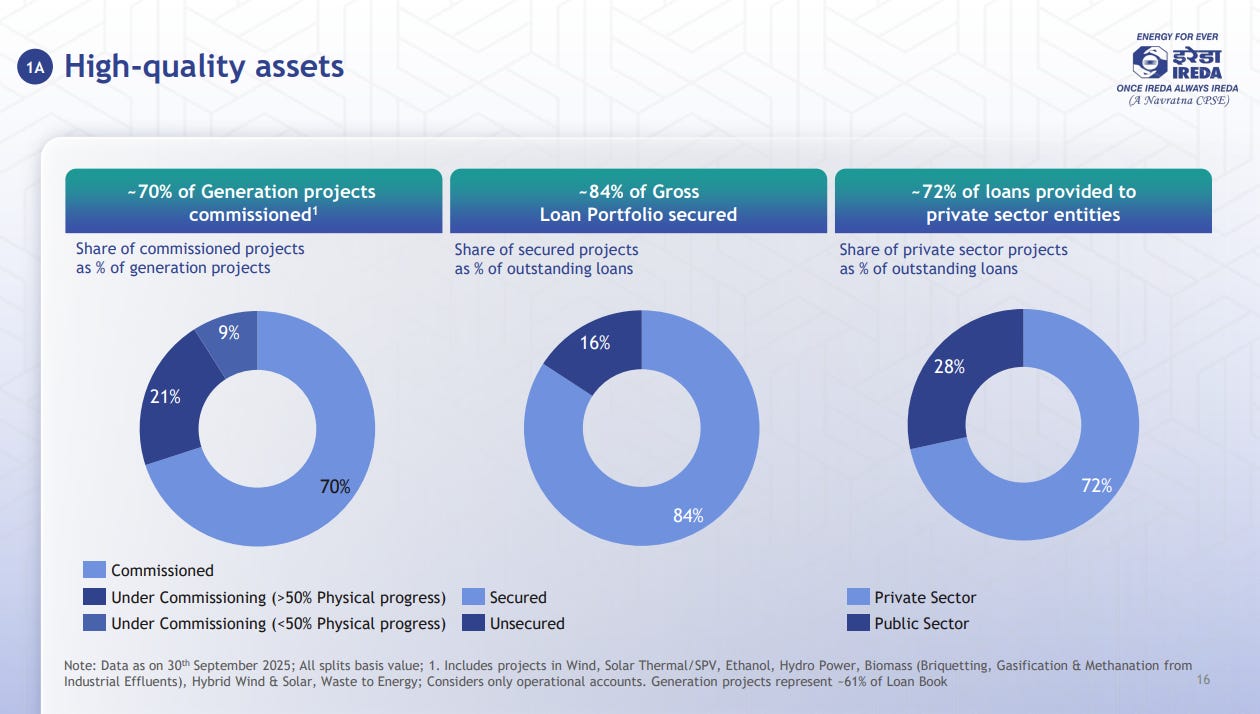
Unlike PFC and REC, whose loan books are dominated by state utilities, IREDA’s portfolio leans heavily toward the private sector — 72% of its loans are to private players. With 70% of generation projects already commissioned and 84% of assets secured, the lender combines growth focus with strong asset quality.
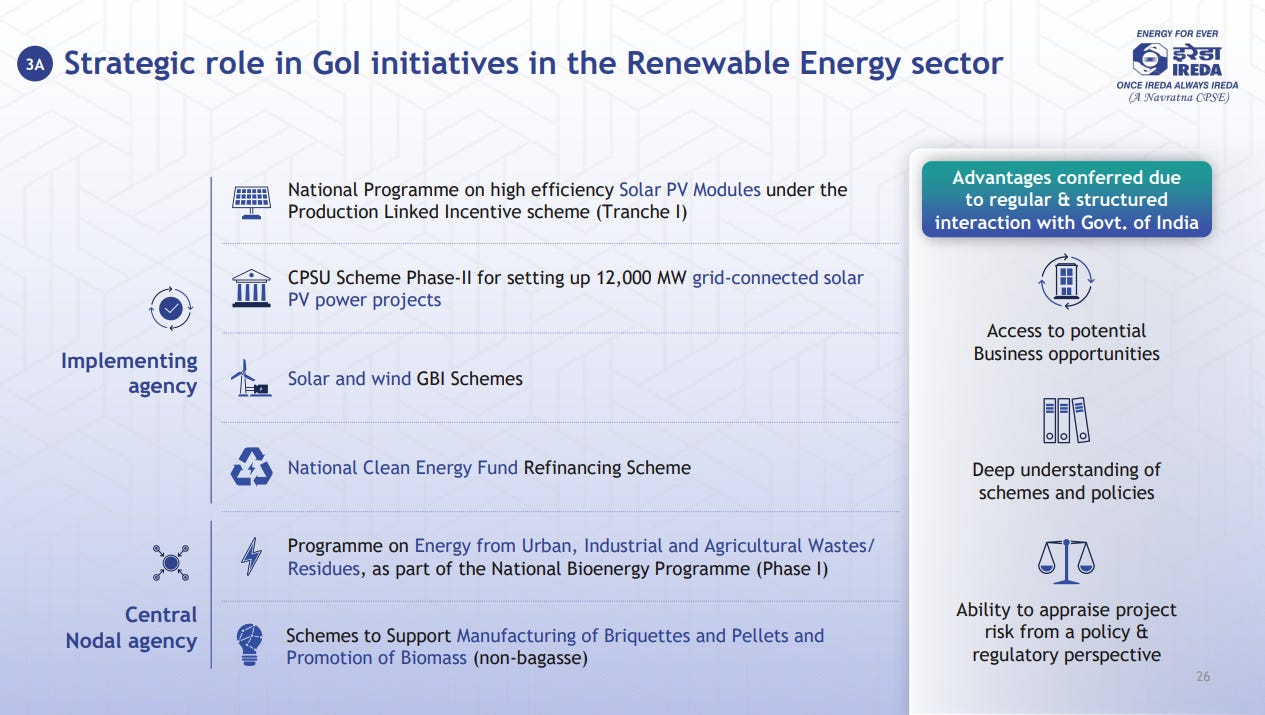
As the implementing and nodal agency for key renewable energy schemes, IREDA’s close coordination with the government gives it a front-row seat to policy execution. This structured engagement helps it identify new business opportunities early, understand regulatory shifts deeply, and accurately assess project risks.
HUDCO | Mid Cap | Financial Services
HUDCO is a key player in housing and infrastructure development, based in New Delhi. With a strong workforce across the country, it primarily provides financing for social housing and residential real estate by lending to State Governments and agencies, benefiting individual beneficiaries.
Affordable housing has steadily increased as a share of the loan book, reaching ~65% in H1 FY26, while urban infrastructure moderated to ~35%. Government lending dominates the portfolio at ~99%, with private sector exposure remaining minimal.
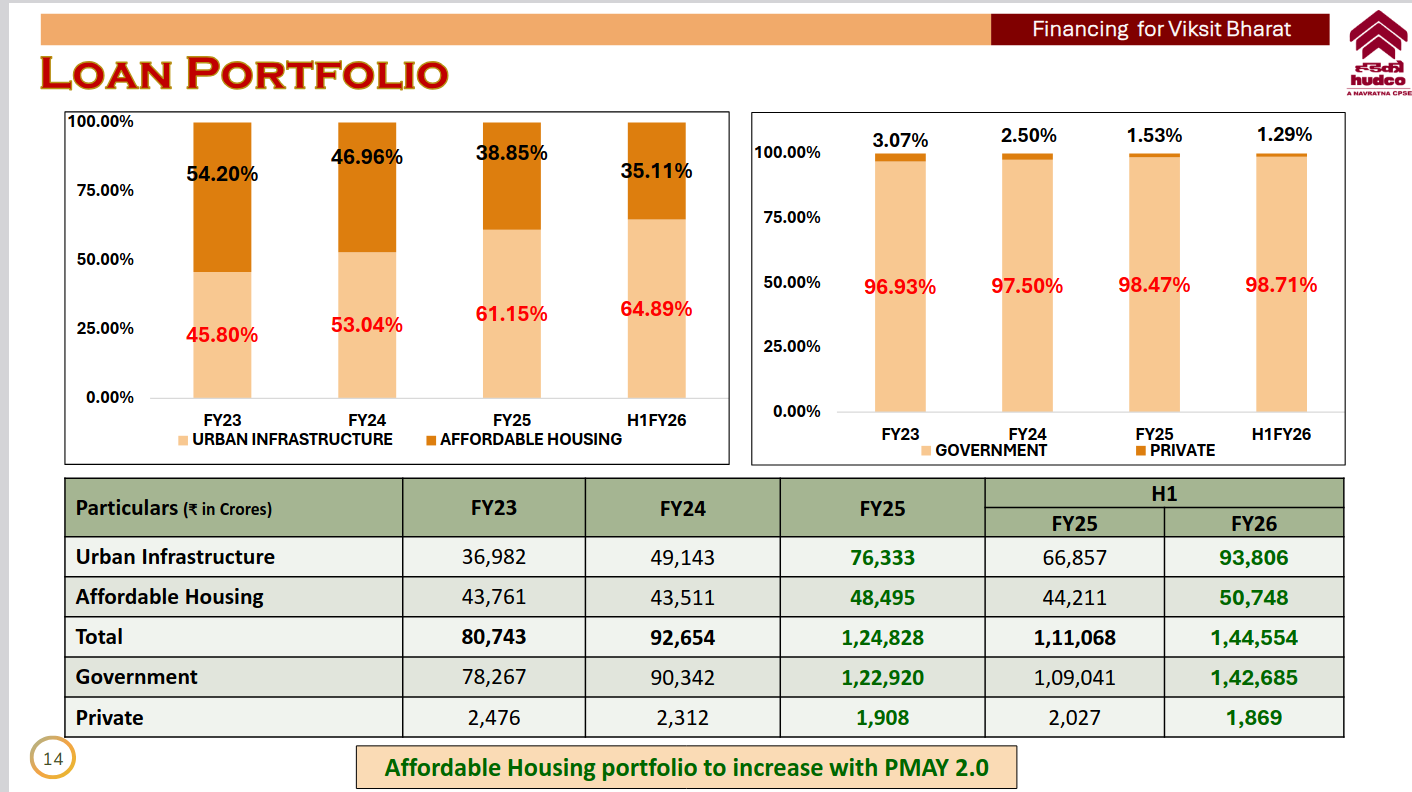
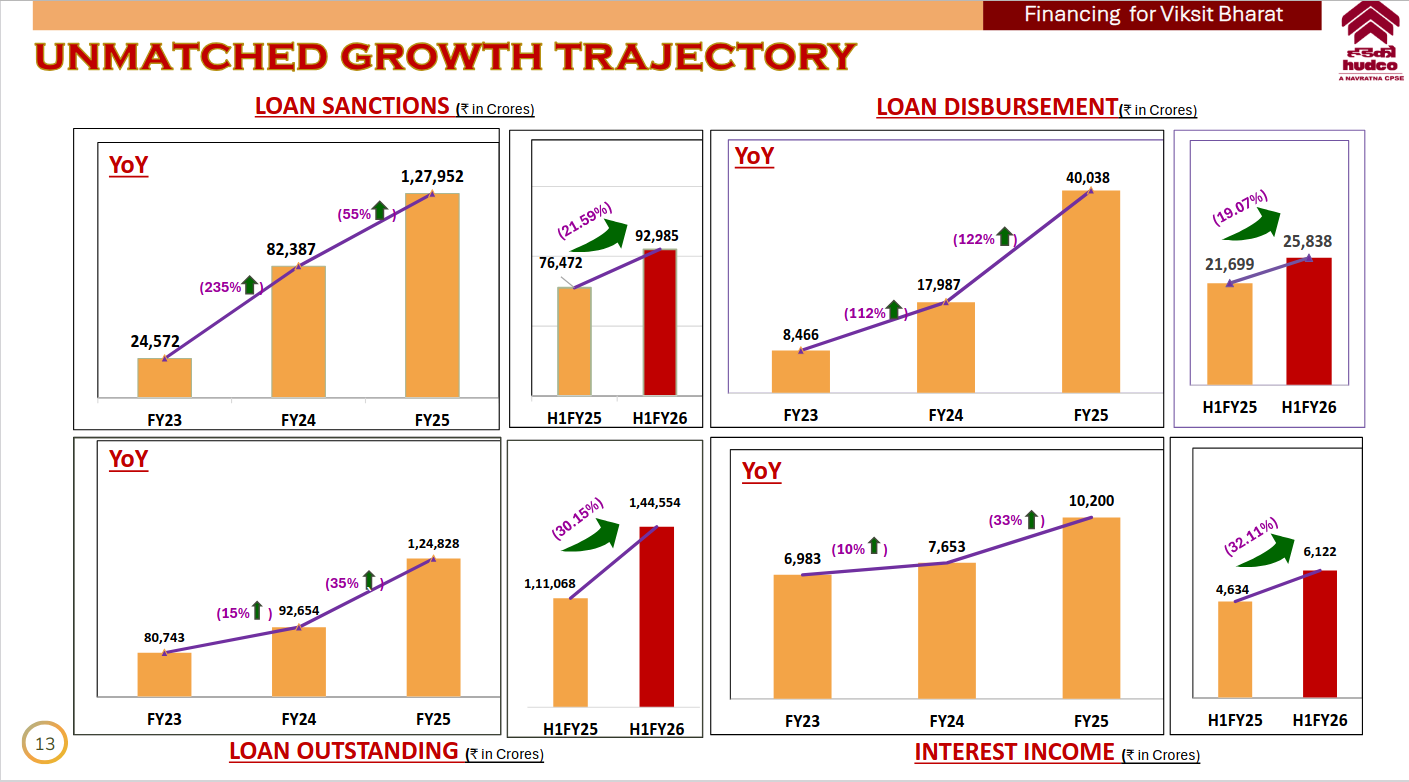
Loan sanctions, disbursements, and outstanding have grown sharply YoY, indicating strong momentum—sanctions up to ₹1.28 lakh crore in FY25 and outstanding crossing ₹1.44 lakh crore in H1 FY26. Interest income has also expanded steadily, reflecting rising deployment and healthy execution.
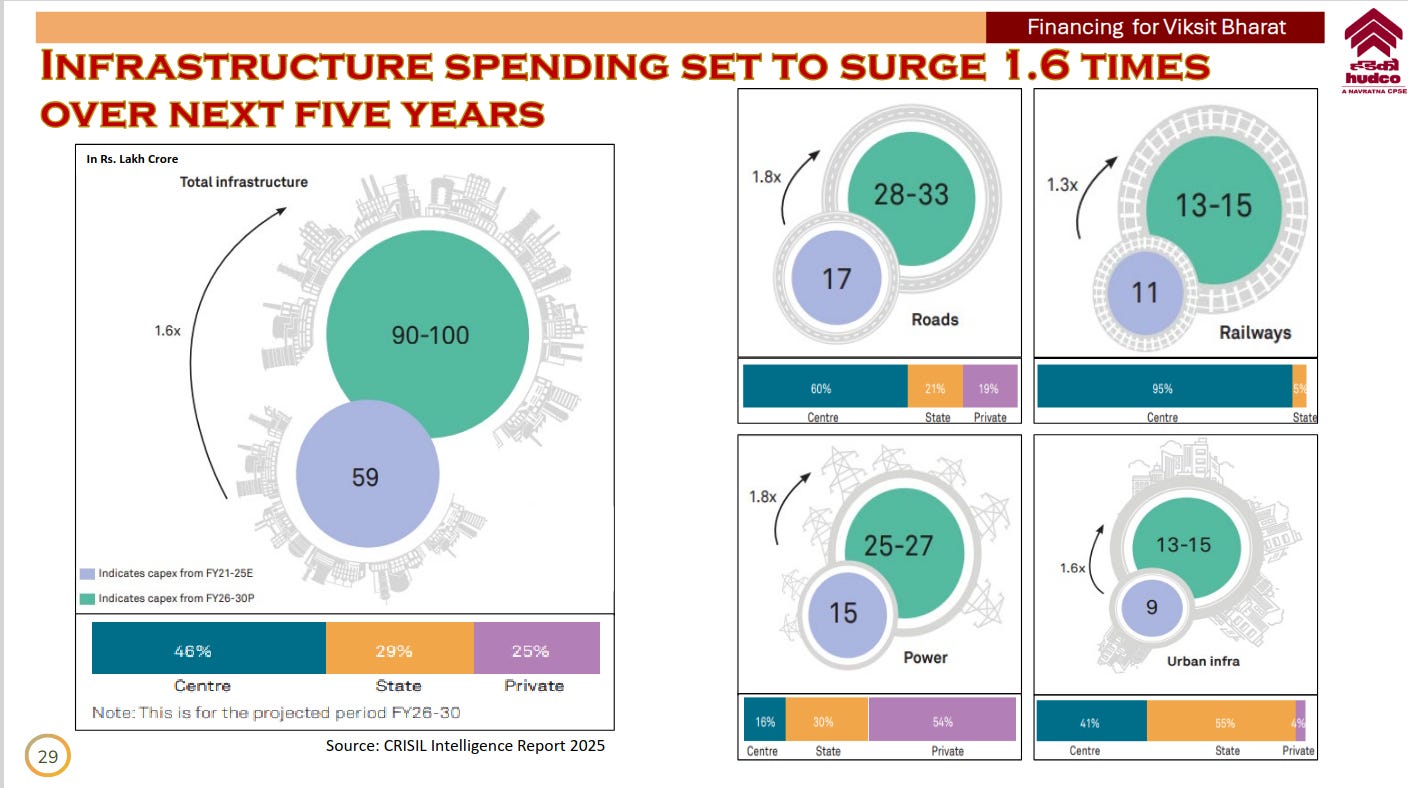
India’s overall infrastructure spending is set to surge 1.6x in FY26–30, led by strong growth in roads (1.8x), power (1.8x), and urban infrastructure (1.6x). Centre, state, and private capex contributions vary by segment, with the Centre dominating railways and states driving urban infra.
Multi Commodity Exch | Mid Cap | Financial Services
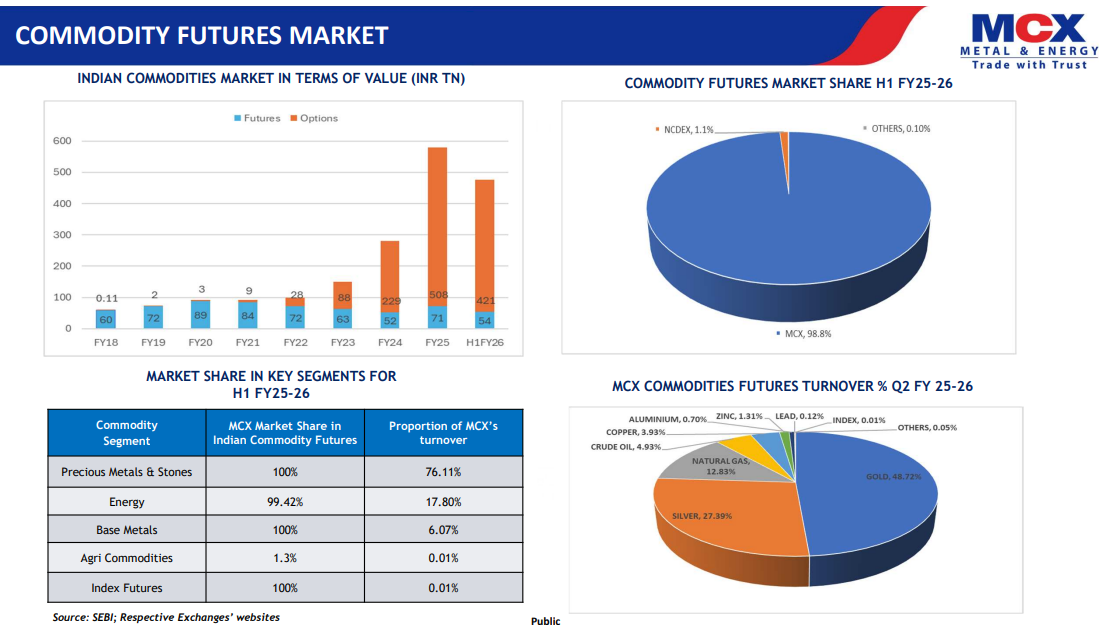
MCX dominates India’s commodity futures market with a commanding 98.8% share in H1 FY25-26. The slide shows how the overall commodity market has grown massively, with options now accounting for the bulk of trading. Within MCX’s business, precious metals—especially gold and silver—drive over three-quarters of turnover, followed by energy products like crude oil and natural gas.
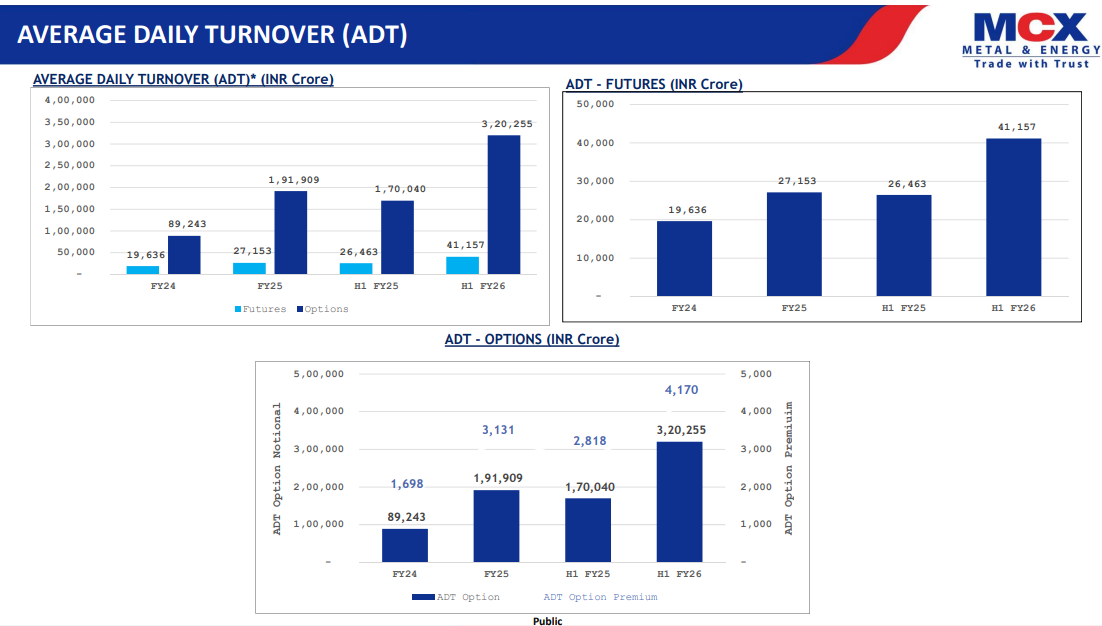
This slide tracks MCX’s trading volumes over time, showing explosive growth in both futures and options. Futures ADT jumped 55% year-on-year to ₹41,157 crore in H1 FY26, while options ADT nearly doubled to ₹3.2 lakh crore. The charts illustrate how options have become the real growth engine, with notional turnover in options far outpacing the traditional futures business.
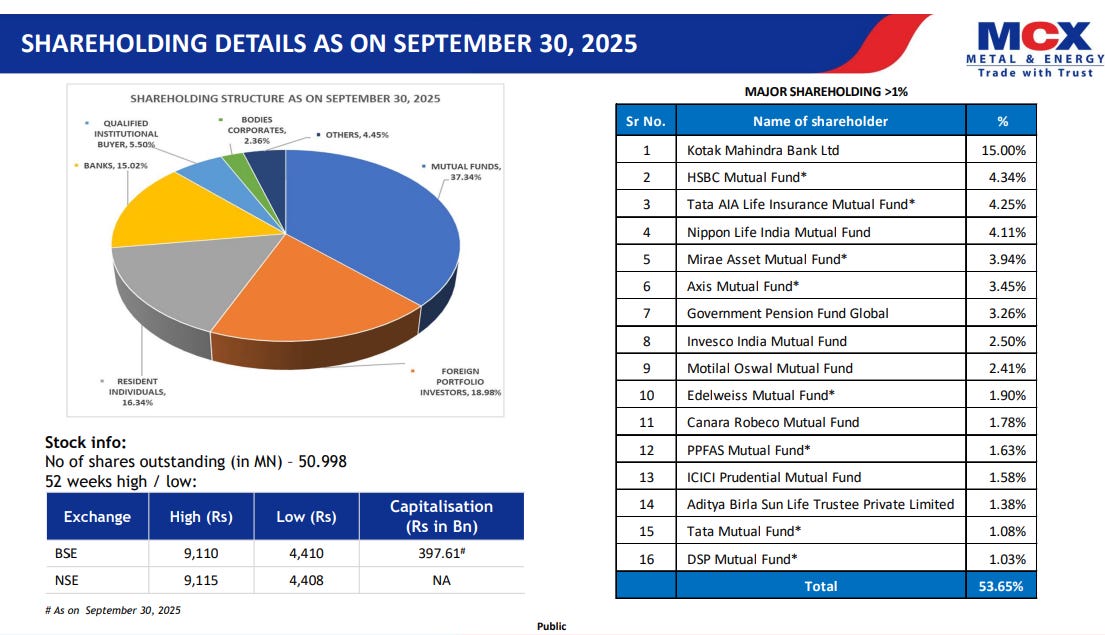
The shareholding pie shows a diverse investor base, with mutual funds holding 37.34% and foreign portfolio investors at 18.98%. Kotak Mahindra Bank is the largest individual shareholder at 15%. The stock trades between ₹4,410 and ₹9,110 over the past year, giving MCX a market cap of nearly ₹40,000 crore as of September 2025.
Chola Invest & Fin. | Large Cap | Financial Services
Cholamandalam Investment and Finance Company is an RBI-registered NBFC-UL, offering diversified financial services including Vehicle Finance, Home Loans, Loan against Property, SME loans, and Unsecured Loans. It operates primarily in India and focuses exclusively on financing activities without separate geographic segments.
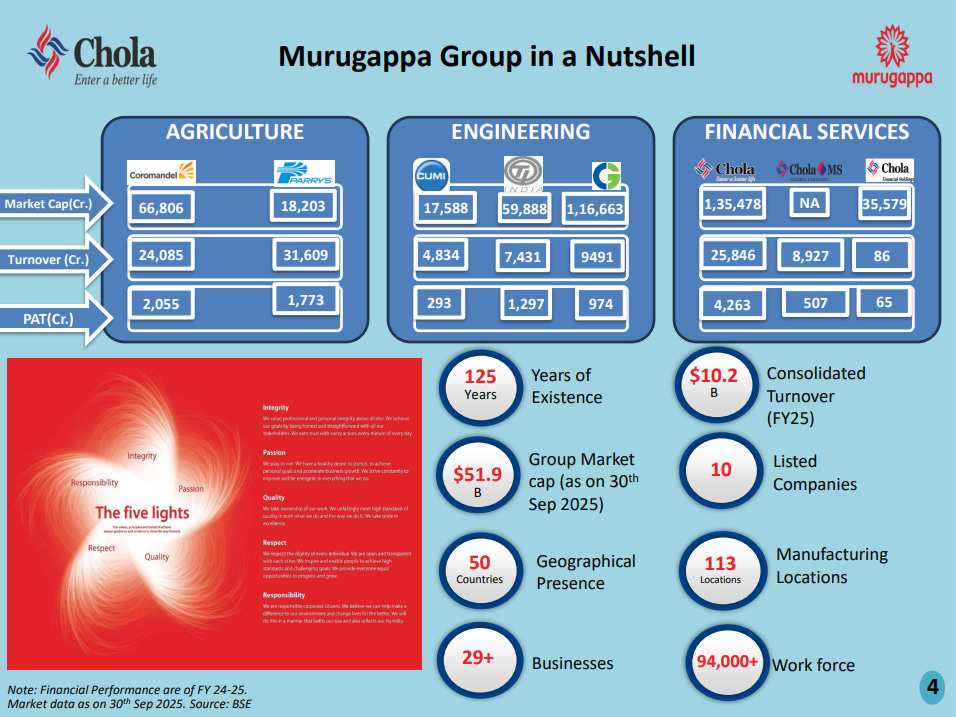
The Murugappa Group is a 125-year-old conglomerate with a presence across agriculture, engineering, and financial services. It clocked a consolidated turnover of $10.2 billion in FY25 and has a combined market cap of $51.9 billion as of September 30, 2025. The group operates through 10 listed companies, runs 113 manufacturing facilities across 50 countries, and employs over 94,000 people across 29+ businesses.
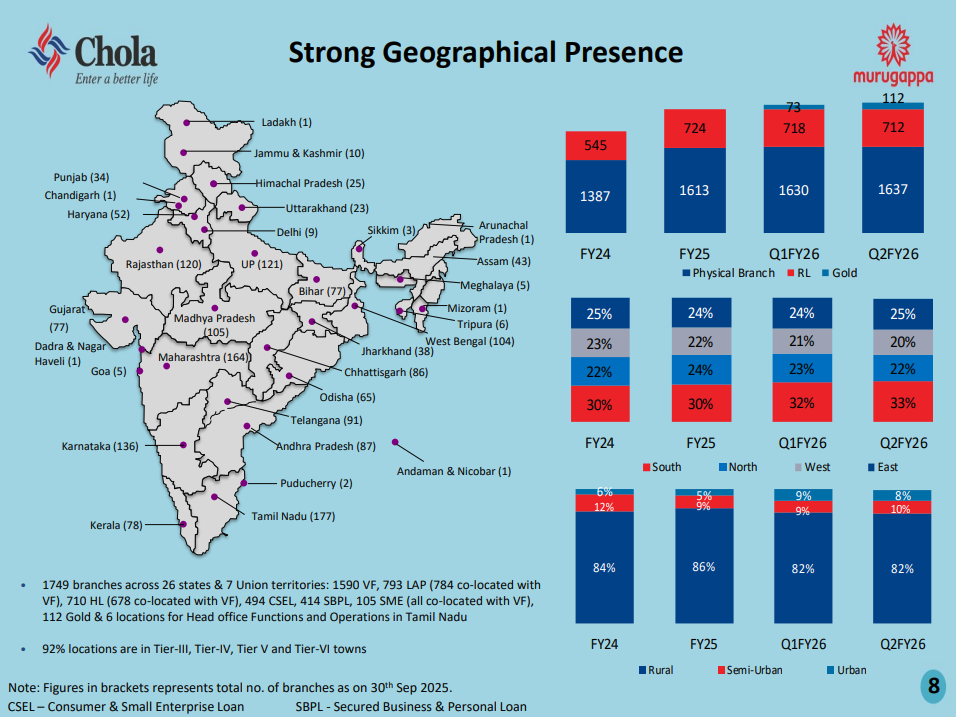
Cholamandalam has 1,749 branches spread across 26 states and 7 union territories, covering vehicle finance, home loans, LAP, CSEL, SBPL, SME, and gold loans. A striking 92% of these branches are in Tier-III to Tier-VI towns, reflecting the company’s focus on rural and semi-urban markets. The southern region accounts for 33% of branches, followed by the east (28%), north (22%), and west (21%), showing a well-distributed national footprint.
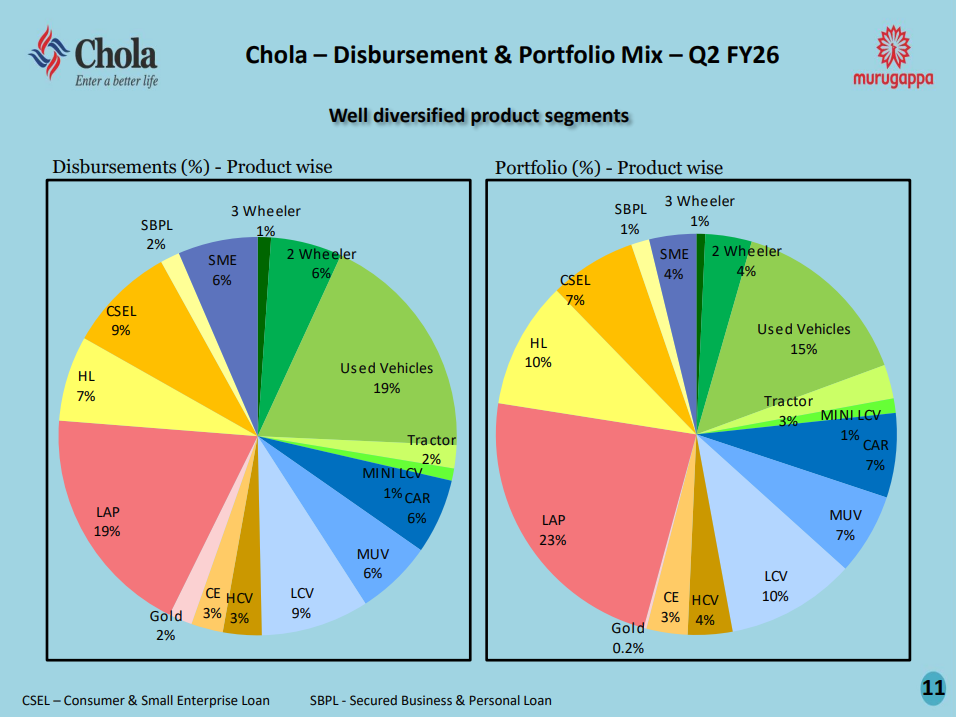
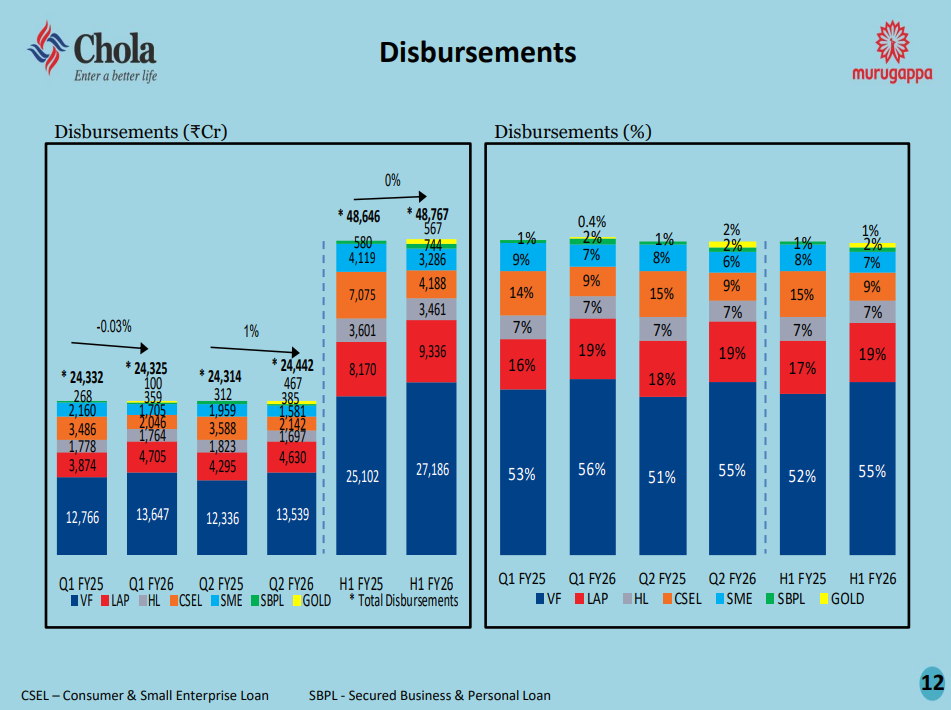
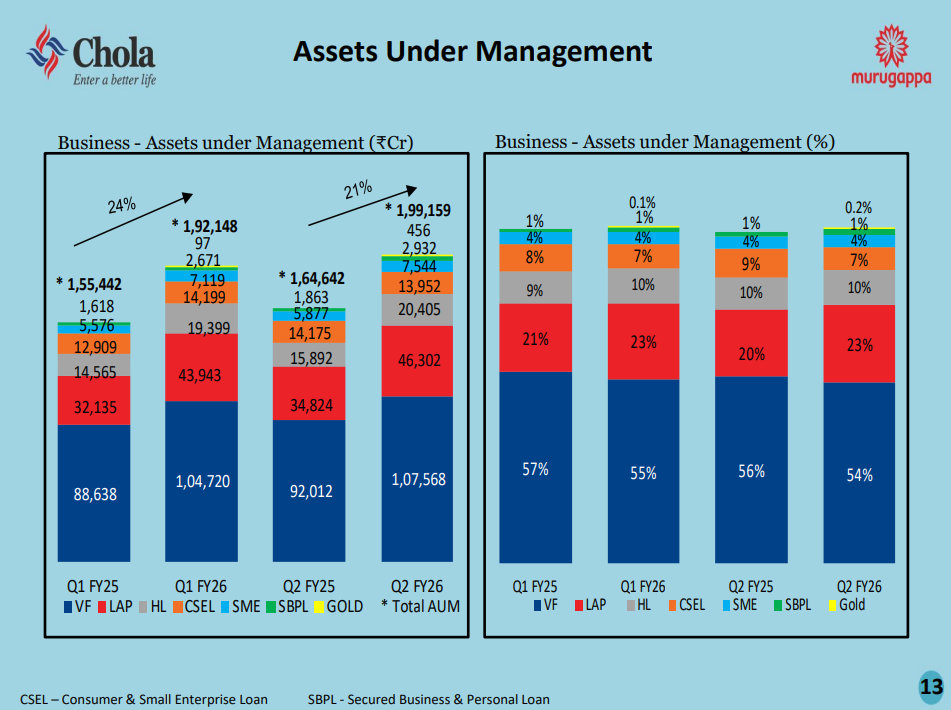
Vehicle finance remains the largest contributor, making up 55% of disbursements and 54% of the portfolio in Q2 FY26. LAP is the second-biggest segment at 19% of both disbursements and portfolio, followed by home loans (7% and 10%) and CSEL (7% and 7%). Within vehicle finance, used vehicles dominate at 19% of the portfolio, followed by LCV (9%), two-wheelers (6%), and cars (6%).
Disbursements in Q2 FY26 stood at ₹24,442 crore, nearly flat compared to Q2 FY25. Vehicle finance led with ₹13,539 crore, while LAP contributed ₹4,630 crore and home loans ₹1,697 crore. For H1 FY26, total disbursements reached ₹48,767 crore, marginally up from ₹48,646 crore in H1 FY25, showing steady momentum across most segments despite some moderation in consumer-facing products.
Chola’s total AUM grew 21% year-on-year to ₹1,99,159 crore in Q2 FY26. Vehicle finance accounts for ₹1,07,568 crore, followed by LAP at ₹46,302 crore and home loans at ₹20,405 crore. CSEL, SME, SBPL, and gold loans make up the rest. The growth reflects strong momentum in LAP and home loans, even as the company maintains a diversified book across products and geographies.
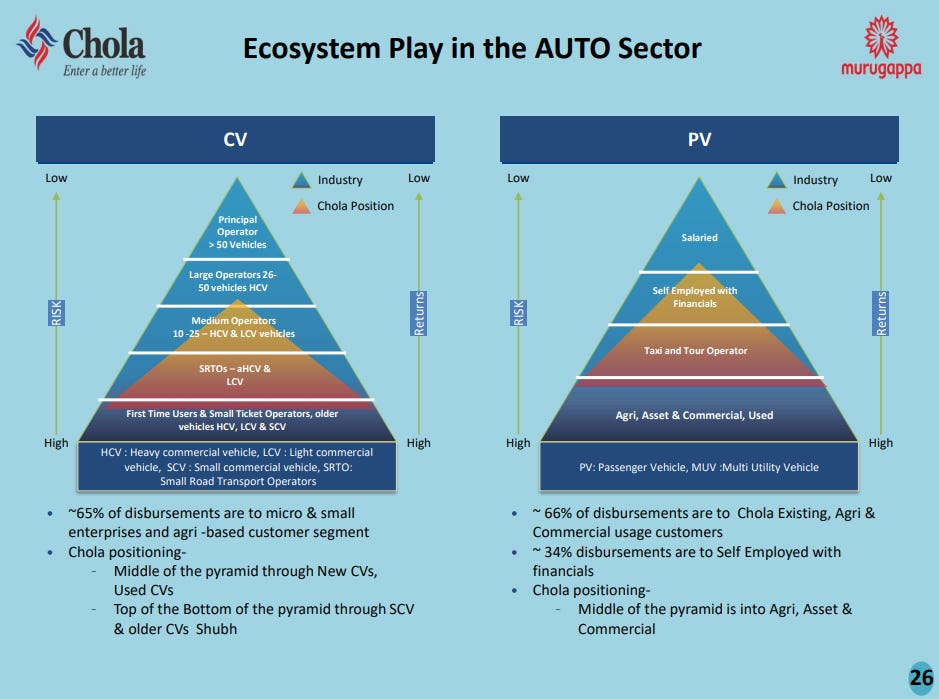
Cholamandalam targets the middle and bottom of the pyramid in commercial vehicles, focusing on micro and small enterprises, agri-based customers, and segments like new CVs, used CVs, and small commercial vehicles. In passenger vehicles, the company serves existing customers, agri and commercial users, and self-employed individuals with financials. The strategy balances risk and return by avoiding the riskiest first-time users while staying accessible to underserved segments.
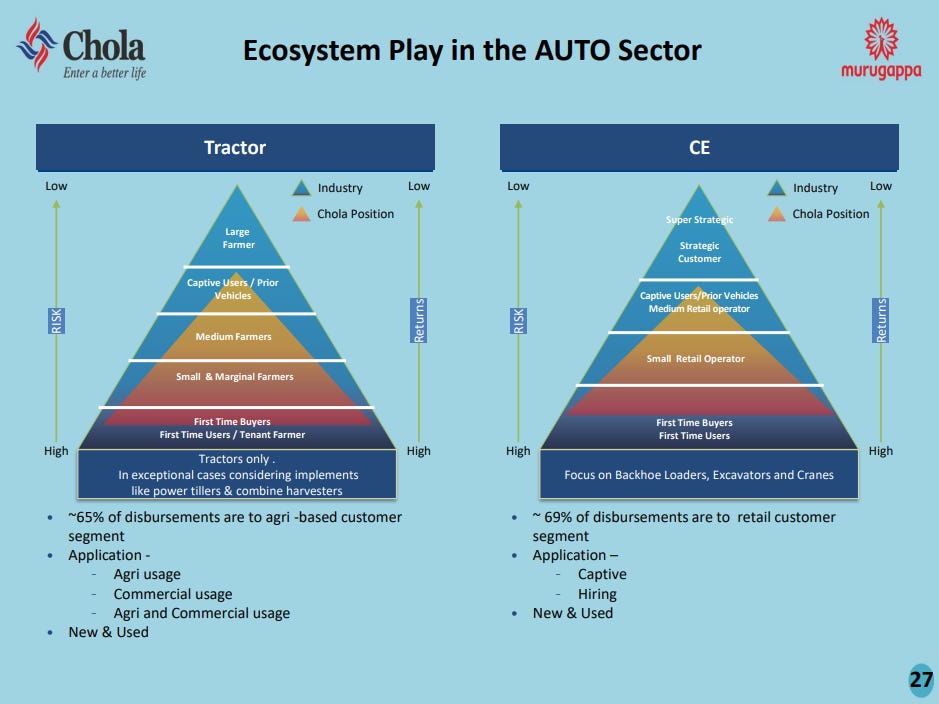
In tractors, Chola focuses on small and marginal farmers, first-time buyers, and tenant farmers, with 65% of disbursements going to agri-based customers. The company finances both new and used tractors but avoids implements except in select cases. In construction equipment, the focus is on backhoe loaders, excavators, and cranes, with 69% of disbursements going to retail customers for captive or hiring use, balancing accessibility with credit discipline.
Chemicals
Neogen Chemicals | Small Cap | Chemicals
Neogen Chemicals specializes in manufacturing Bromine based compounds, Grignard Reagents, and Inorganic Lithium Salts. It is a leading supplier to pharmaceutical, agrochemical, and specialty chemical companies in India, Europe, and Japan. Along with Bromination and Grignard chemistry, Neogen has expertise in Alkylation, Acylation, Friedel Craft, Couplings, Chlorination, and other related chemical processes.
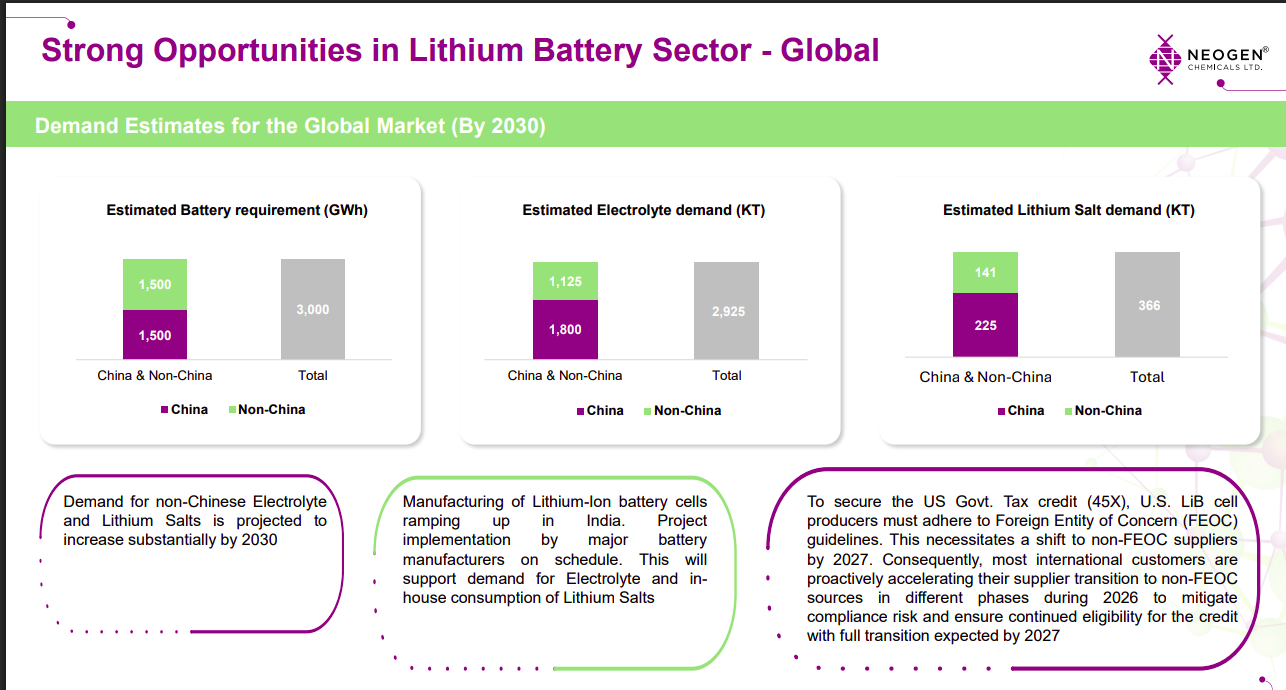
Global lithium battery demand is set to surge by 2030, with total battery demand reaching 3,000 GWh and electrolyte/lithium salt consumption rising sharply. Non-China demand is expected to expand significantly as manufacturers diversify supply chains. FEOC rules in the US are accelerating the shift toward non-Chinese suppliers by 2027.
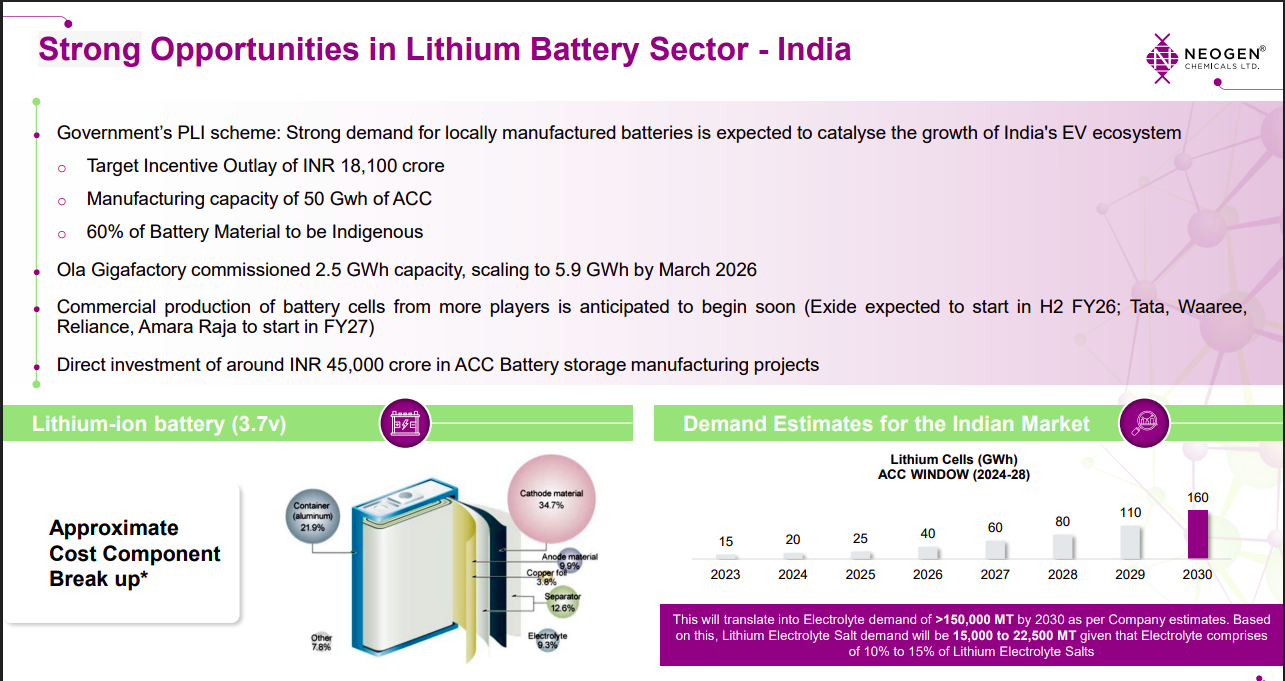
India’s PLI scheme and rising EV adoption are driving strong demand for local battery manufacturing, targeting 50 GWh ACC capacity. Multiple players including Ola, Exide, Tata and Reliance are scaling gigafactory capacity. India’s lithium cell demand is expected to reach 160 GWh by 2030, triggering >150,000 MT electrolyte demand.
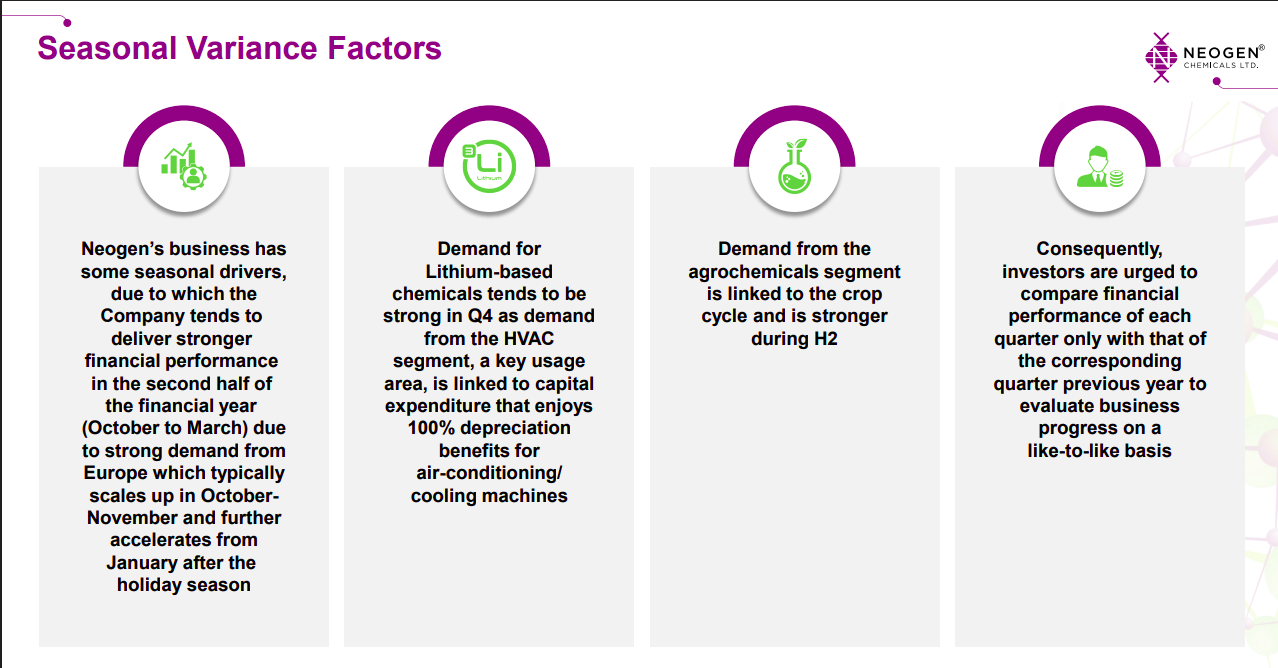
Neogen’s financial performance is seasonally stronger in H2 due to increased European demand and HVAC-related lithium chemical demand in Q4. Agrochemical demand follows crop cycles, peaking in H2. Investors should compare YoY quarterly performance rather than sequential quarters due to these structural seasonal patterns.
Engineering & Capital Goods
Jyoti CNC Automation | Small Cap | Engineering & Capital Goods
Jyoti was established in 1989 by Mr. P.G. Jadeja and Mr. S.L. Jadeja with a vision to become a ‘Temple of Technology’. They started by manufacturing gear boxes and later shifted to producing precision all-geared head lathe machines. Jyoti is known for being the first company to manufacture CNC machines in Gujarat and continues to innovate by introducing advanced machines like CNC Turning Centers and Vertical Machining Centers.
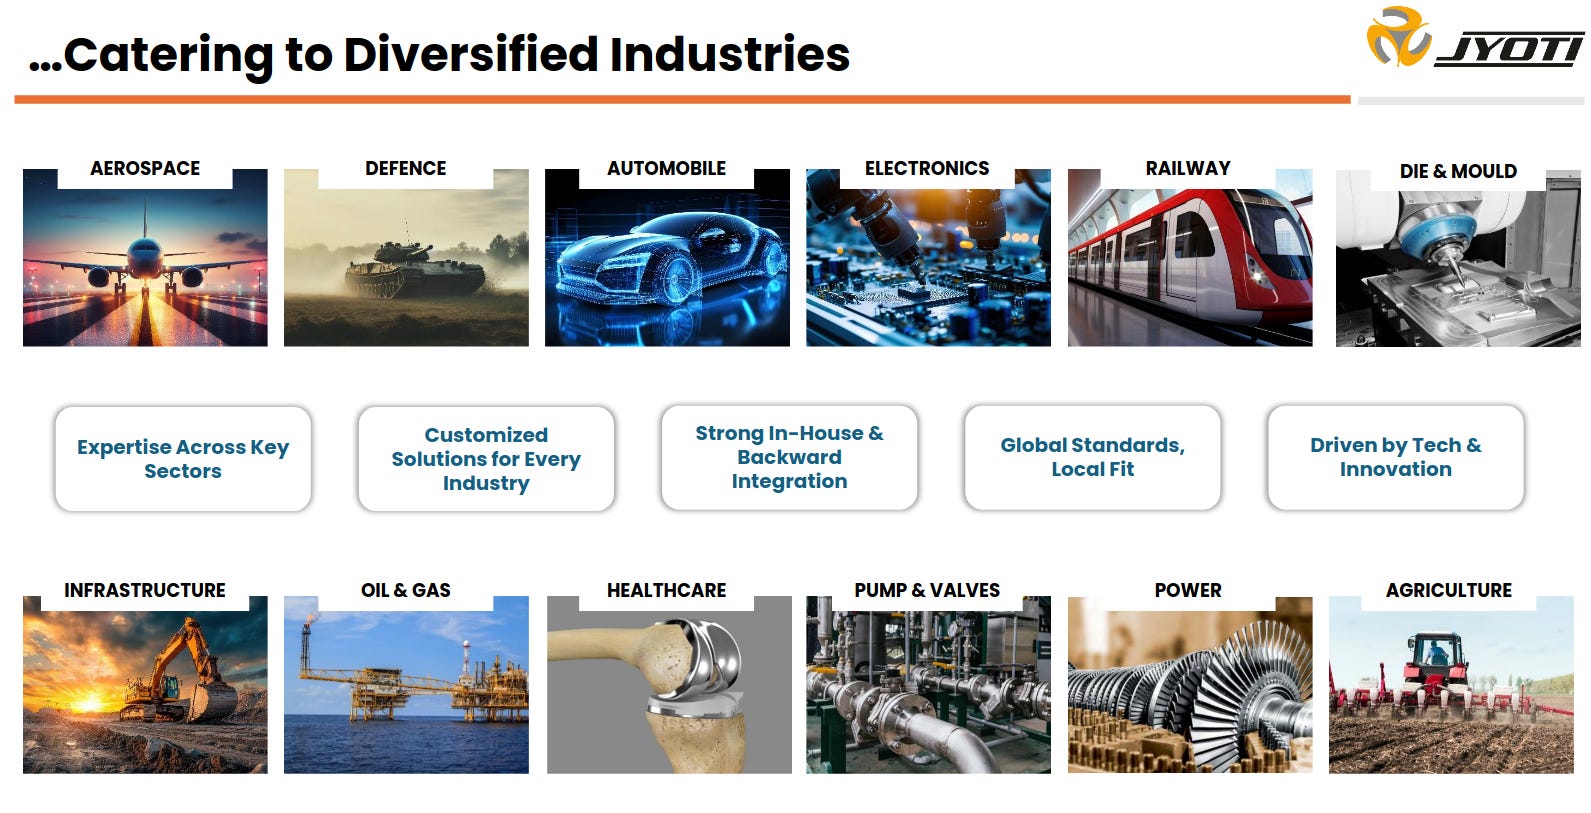
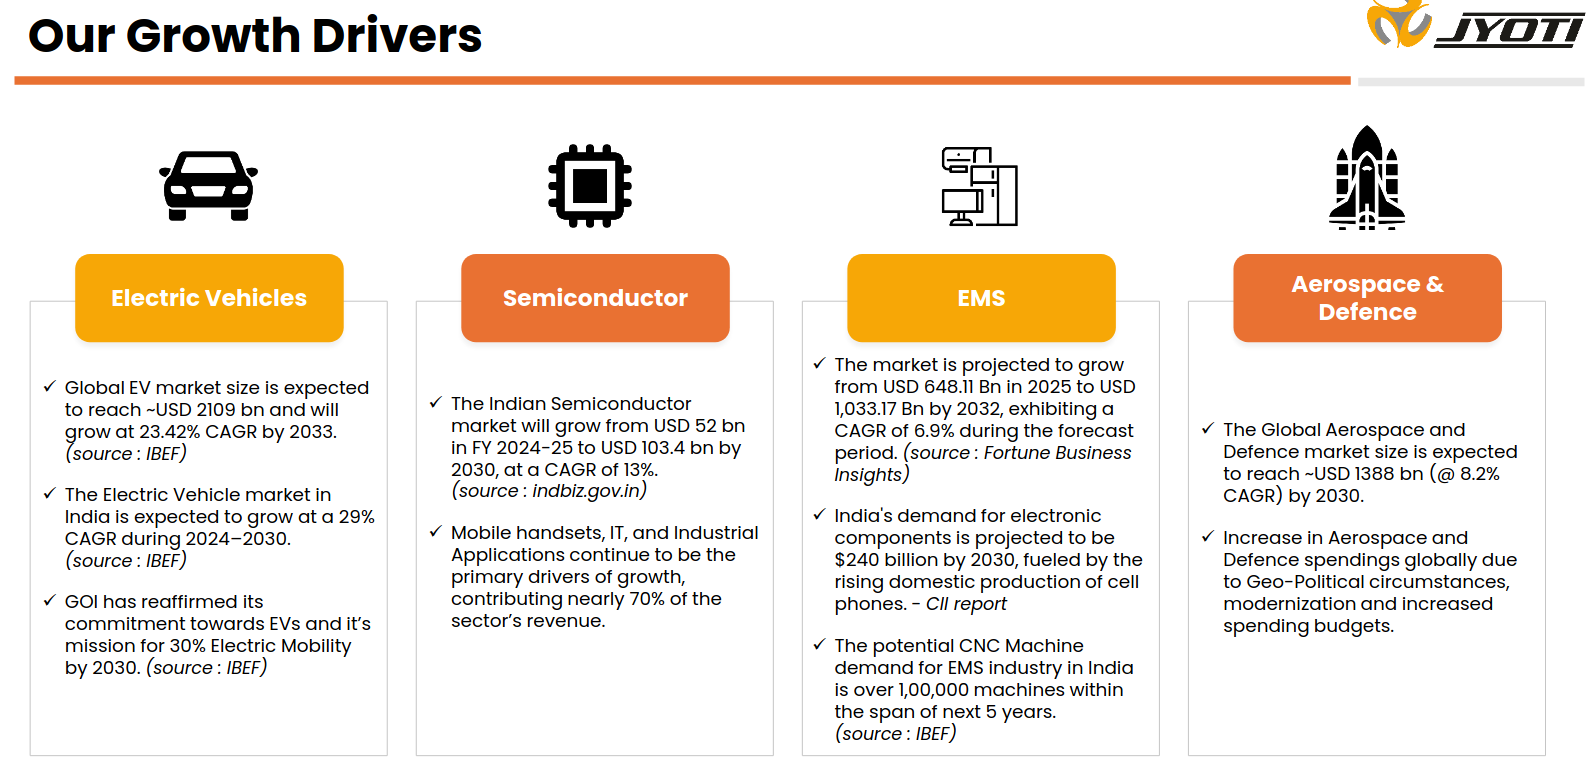
Jyoti caters to a wide spectrum of industries—from aerospace, defence, automobile, and electronics to agriculture and infrastructure—highlighting deep sectoral expertise. Its strong in-house capabilities, global standards, and tech-driven innovation enable custom solutions across mission-critical applications.
EV, Semiconductor, EMS, and Aerospace/Defence are the key structural growth engines for Jyoti. Each sector is set for strong multi-year expansion, supported by rising domestic demand, government push, and global capex cycles—offering sustained opportunity for CNC machine consumption.
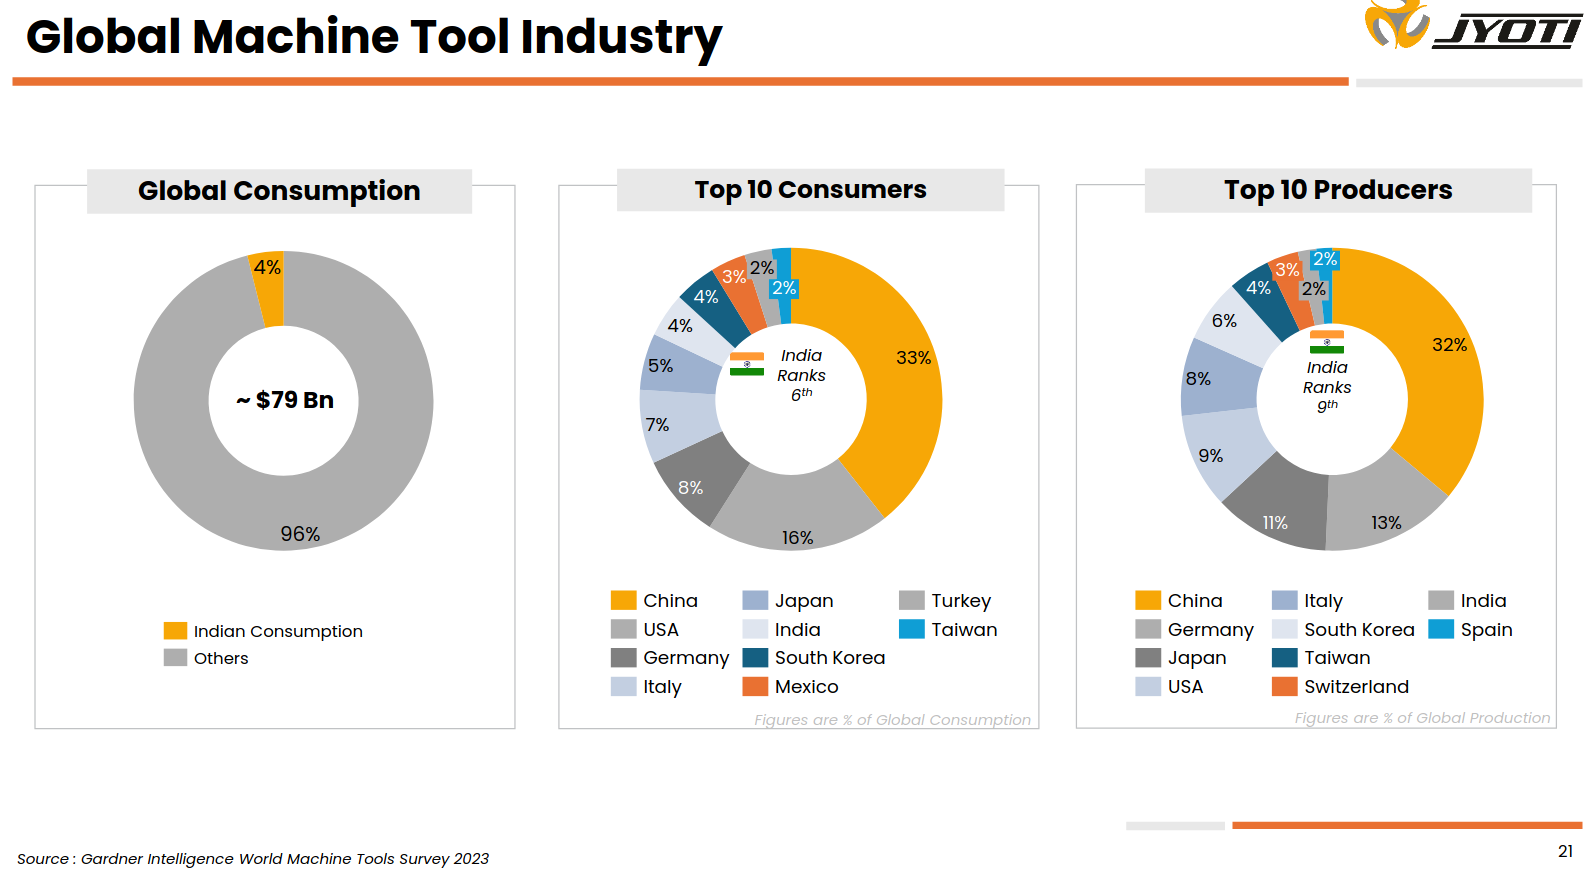
The global machine tool market is a ~$79B industry, with India contributing 4% of consumption. India ranks 6th globally in machine tool consumption and 9th in production, showing strong domestic demand momentum and rising manufacturing capability.
Graphite India | Small Cap | Engineering & Capital Goods
Graphite India Limited (GIL) was established in 1964 in collaboration with The Great Lakes Carbon Corporation of USA. The company specializes in manufacturing Graphite electrodes, graphite equipments, steel, GRP pipes and tanks, and also generates hydel power. GIL is a pioneer in Carbon and Graphite products in India, with a focus on expanding its production capacity and venturing into specialty applications of carbon and graphite.
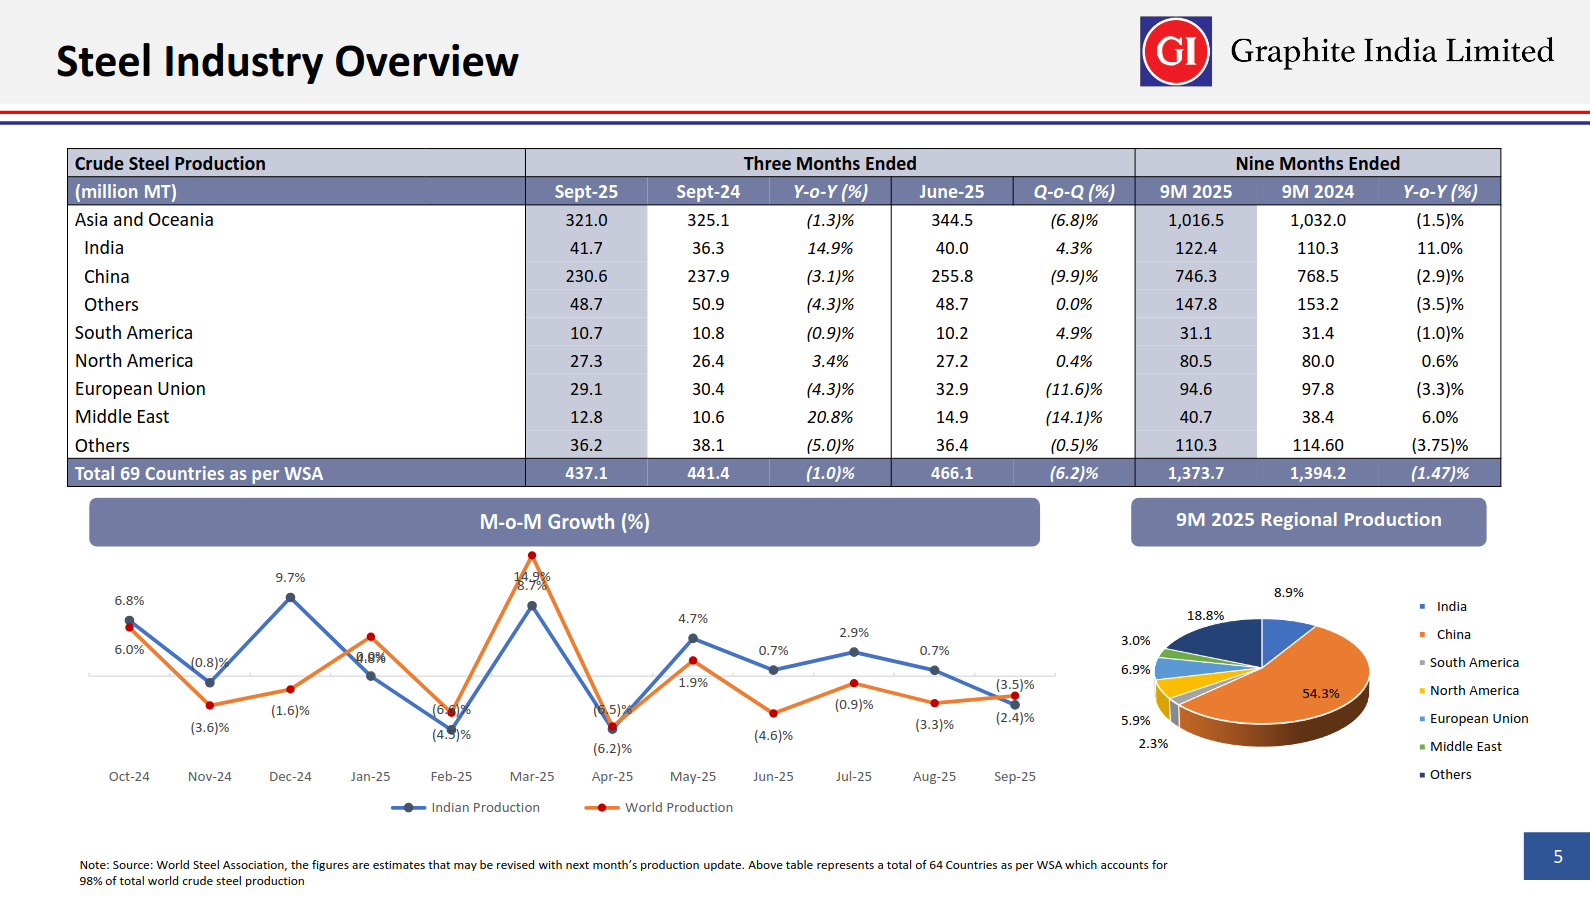
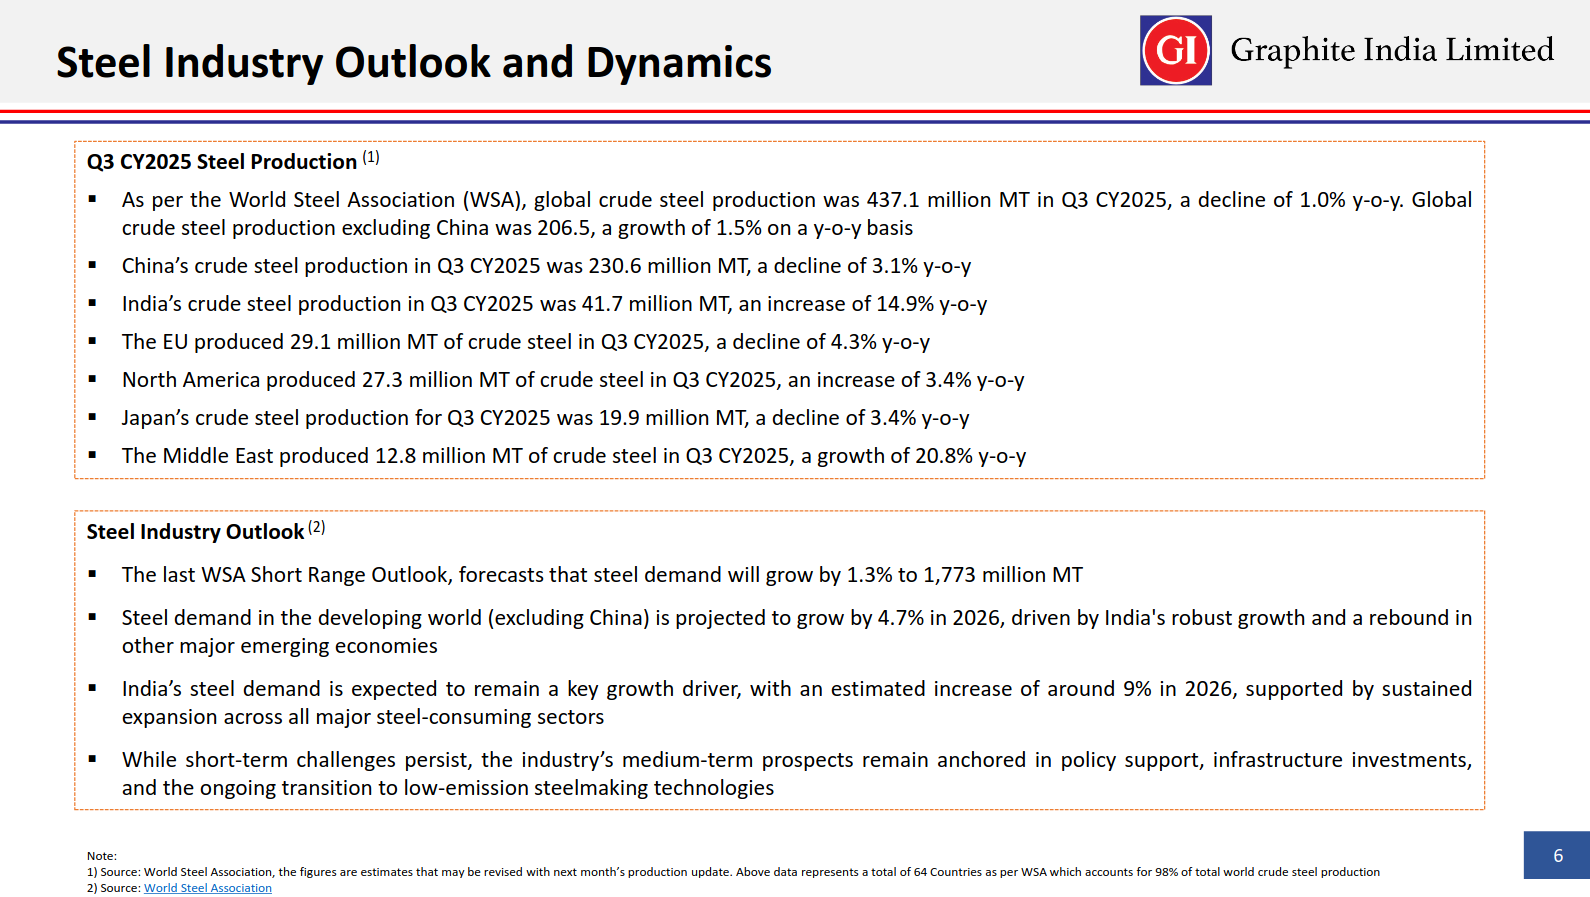
Global crude steel production declined 1% YoY in Q3 CY25 to 437.1 MT, driven by a sharp fall in China and EU output. India stood out with strong 14.9% YoY growth, while North America and the Middle East also posted healthy increases.
Global steel demand is expected to rise 1.3% in 2026, with developing economies (ex-China) projected to grow at 4.7%. India remains the key growth driver, with steel demand forecast to increase around 9% in 2026 supported by broad-based consumption and strong infrastructure momentum.
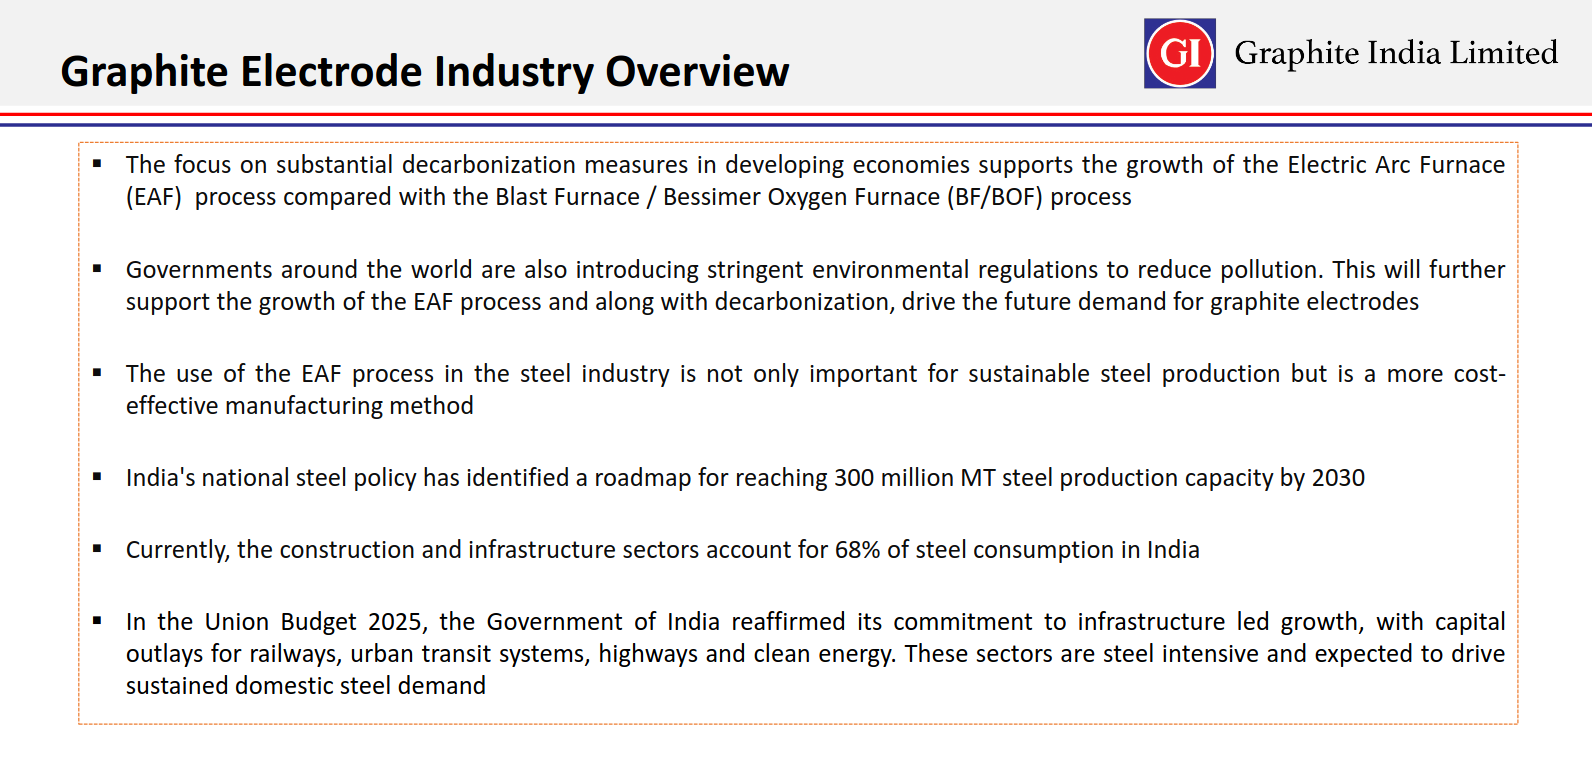
Decarbonisation and tighter global environmental regulations are accelerating the shift toward Electric Arc Furnace (EAF) steel production, boosting long-term demand for graphite electrodes. India’s policy push toward 300 MT steel capacity by 2030 and increased infrastructure spending strengthens domestic demand visibility for electrode producers.
Energy
Deep Industries | Small Cap | Energy
Deep Industries is a leading solution provider in the energy sector, offering services such as Air & Gas Compression, Drilling, Gas Dehydration, and Integrated Project Management. With a focus on people, environment, and innovative technology, they cater to global energy needs with a range of equipment for the oil and gas industry. Certified by Bureau Veritas and ISO, the company adheres to quality and safety standards.
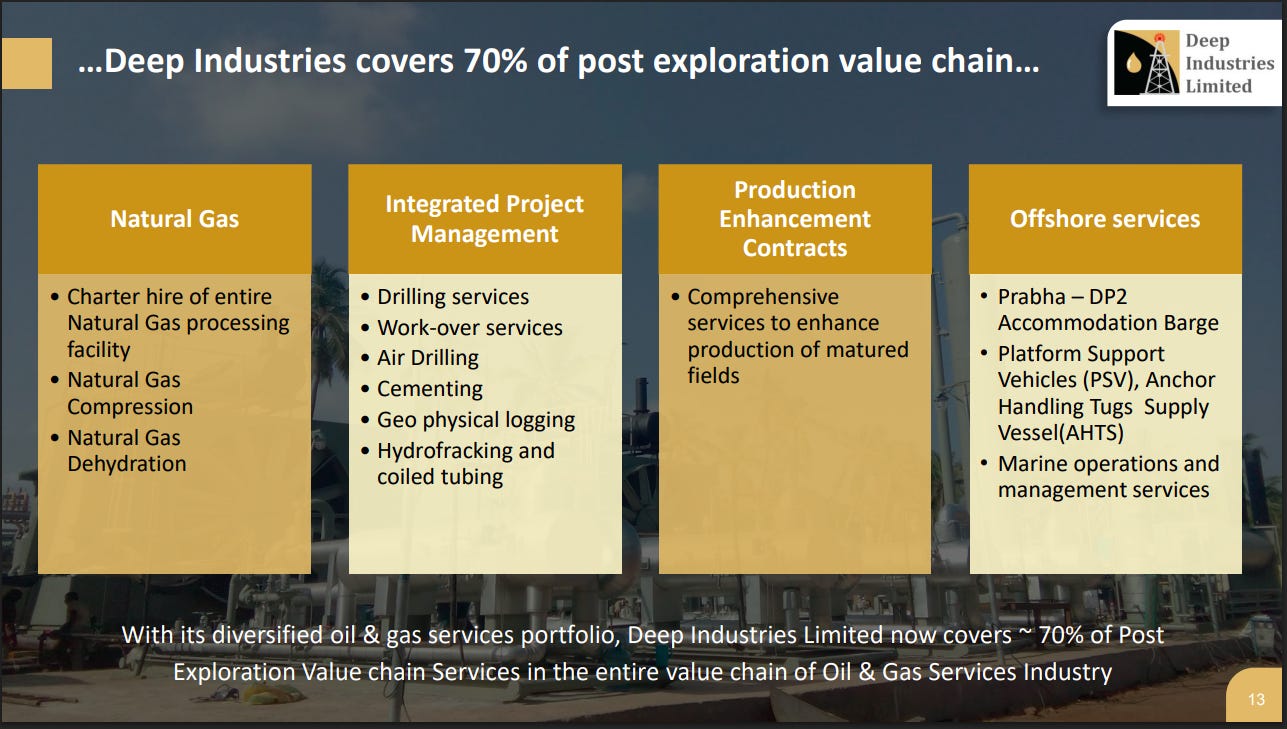
Deep Industries now covers nearly 70% of the post-exploration oil & gas value chain, offering services spanning natural gas processing, drilling, workovers, compression, dehydration, and production enhancement. The company also provides offshore support through DP2 barges, PSV/AHTS vessels, and marine operations.
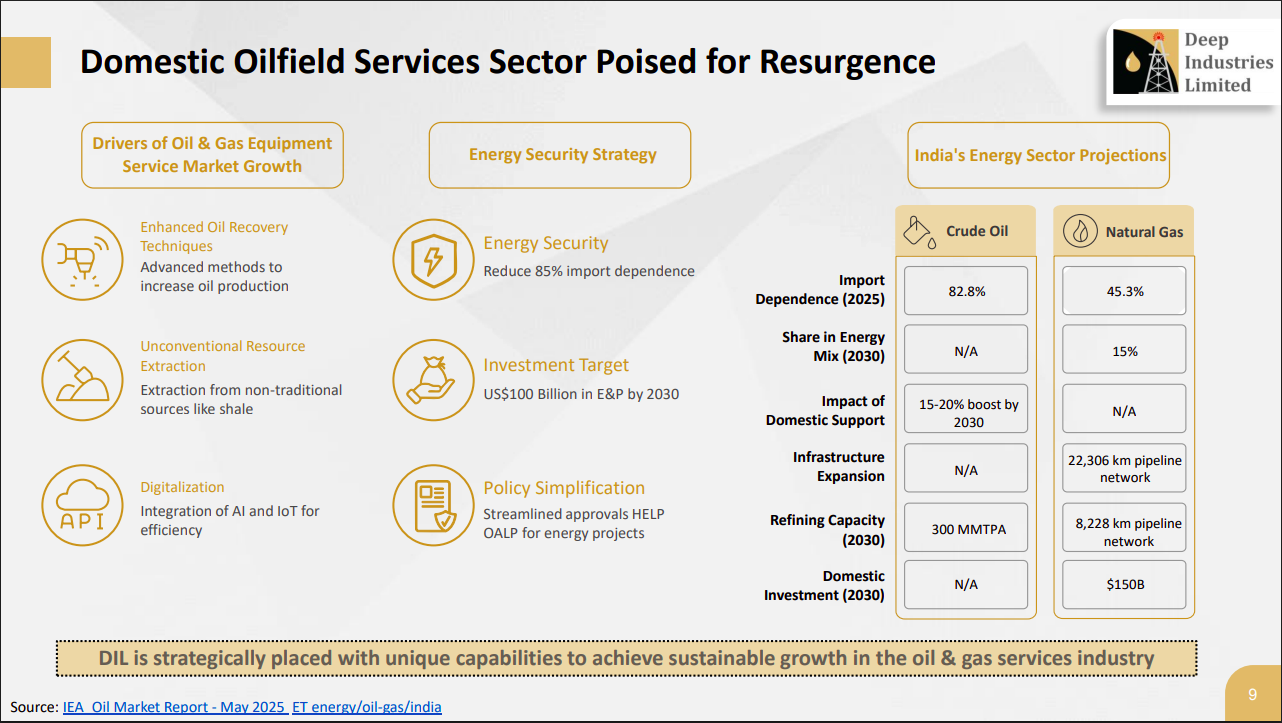
India’s oil & gas services sector is poised for strong revival driven by enhanced oil recovery, unconventional resource extraction, digitalization, and energy-security-focused investments. With an investment target of $100B by 2030, rising domestic support, expanding infrastructure, and policy simplification, Deep Industries is strategically positioned to benefit from the long-term growth cycle.
Plastic Pipes
Kriti Industries (India) | Micro Cap | Plastic Pipes
Kriti Industries (India) Ltd. specializes in manufacturing and processing polyvinyl chloride (PVC), low density polyethylene (LDPE), and high density polyethylene (HDPE) pipes and fittings for various industries like construction, gas, and industrial fluids. Their product range includes SWR Pipes, HDPE ducts, and fittings across sectors like agriculture, micro irrigation, sewage, and telecommunications. Established in 1980, Kriti Group is known for its diverse line of products catering to industrial and domestic usage.
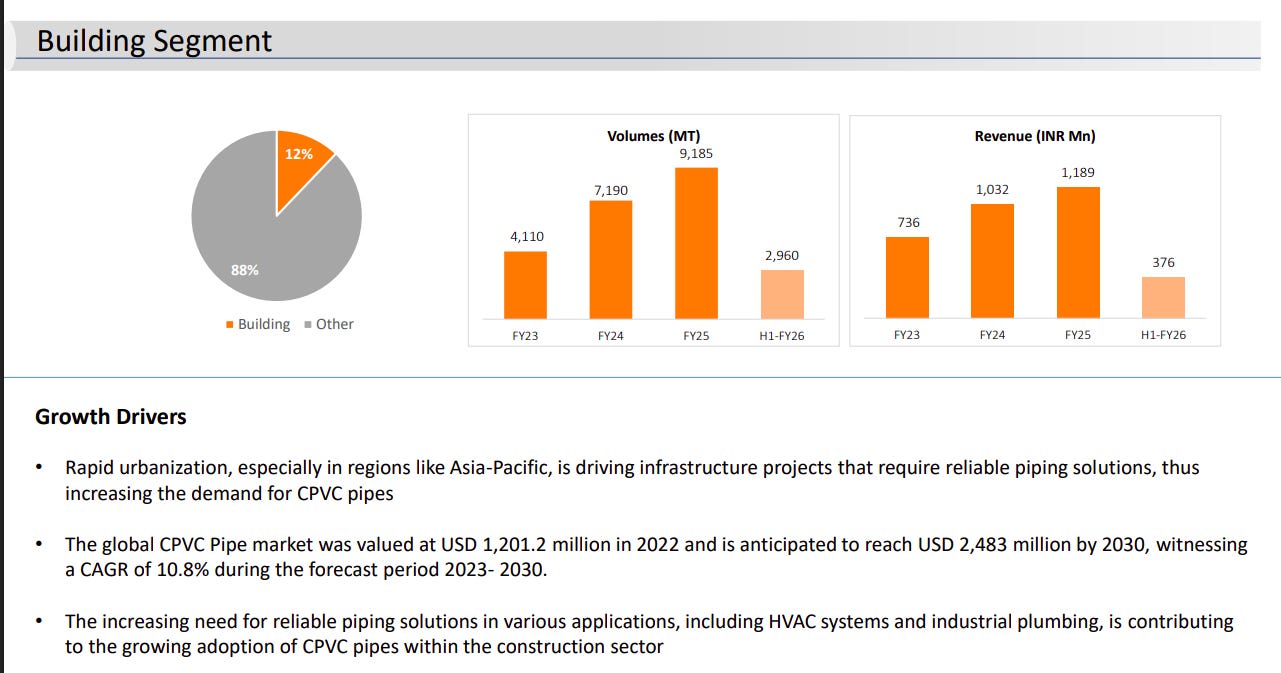
The building segment is steadily expanding with volumes rising from 4,110 MT in FY23 to 9,185 MT in FY25, though H1-FY26 shows a softer trend due to seasonality. Strong urbanization, infrastructure development, and demand for reliable CPVC piping systems continue to drive growth in this category.
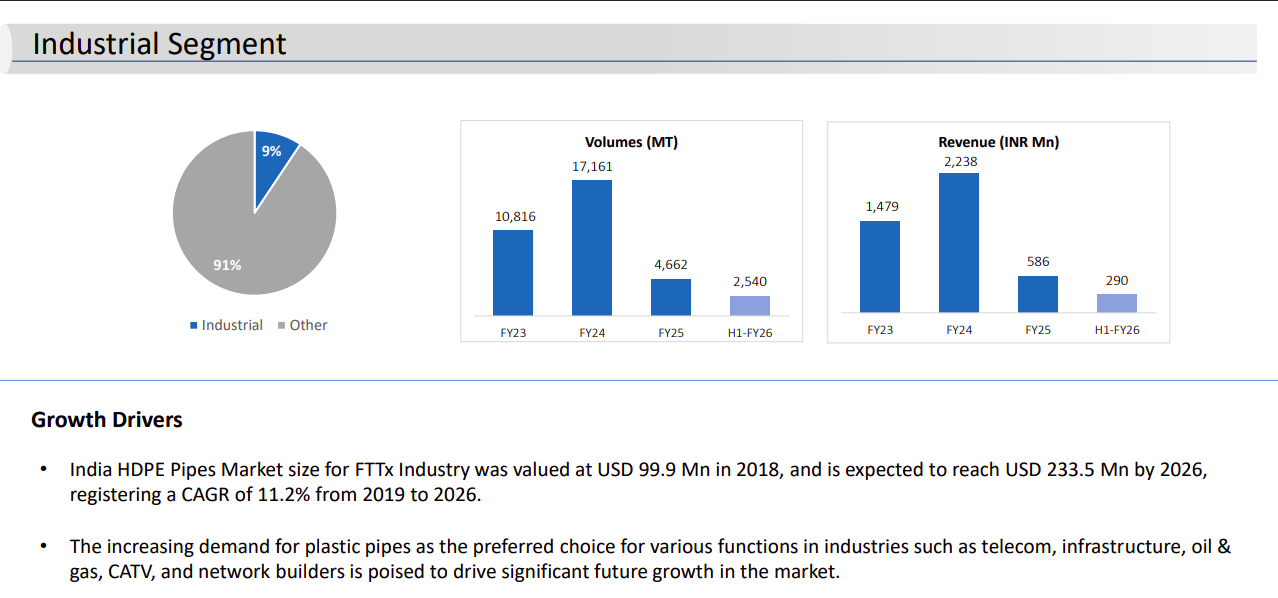
Industrial volumes saw a sharp jump in FY24 but moderated in FY25 due to cyclical demand corrections, with H1-FY26 showing gradual normalization. Rising HDPE pipe demand from telecom, FTTx expansion, oil & gas infrastructure, and utilities remains the key growth engine for this segment.
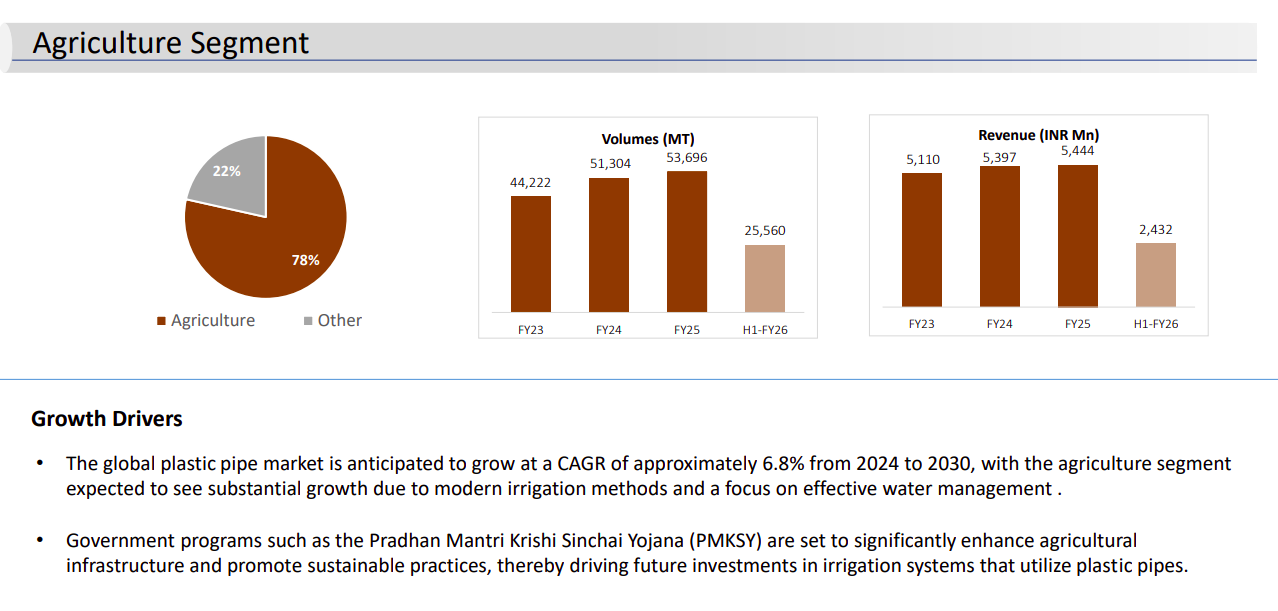
Agriculture remains the largest volume contributor, showing consistent growth through FY23–FY25 driven by irrigation demand, before easing in H1-FY26 due to seasonality. Government irrigation schemes, focus on water management, and rural infrastructure investment continue to provide strong long-term tailwinds.
Auto Ancillary
Ather Energy | Small Cap | Auto Ancillary
Ather Energy is a leading EV company in India that specializes in selling electric two-wheelers (E2Ws) along with a comprehensive product ecosystem including software, charging infrastructure, and smart accessories. They offer two product lines, the Ather 450 and the Ather Rizta, with a total of seven variants.
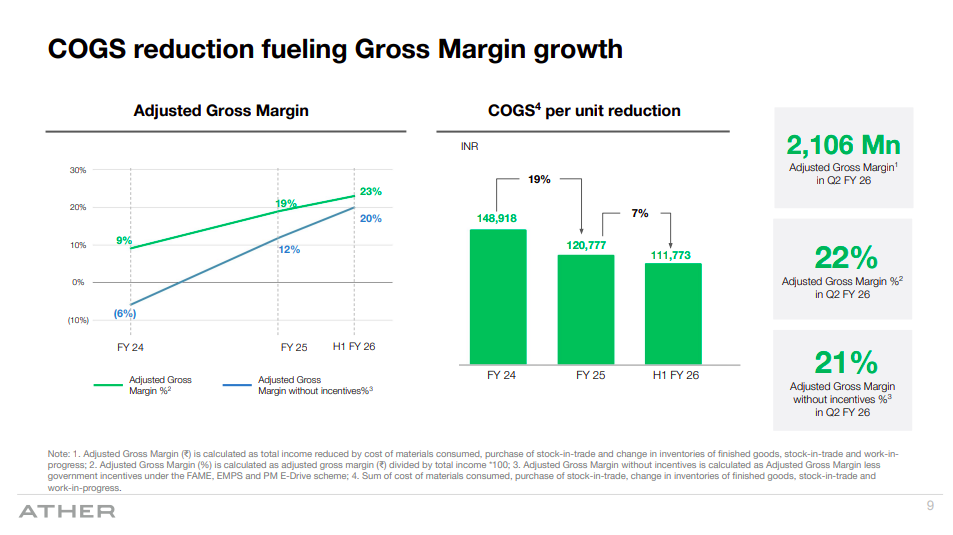
Ather’s gross margins continue to improve as COGS per unit has fallen sharply from ₹1,48,918 in FY24 to ₹1,11,773 in H1 FY26. Adjusted gross margin has expanded to 23% (21% without incentives), reflecting disciplined cost optimisation and scale benefits.
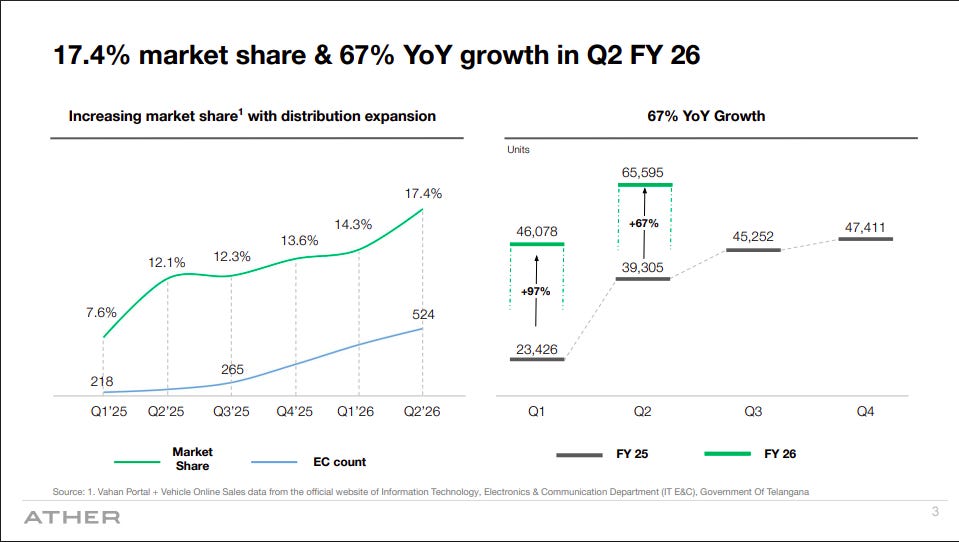
Ather’s market share has risen steadily to 17.4% by Q2 FY26, supported by rapid expansion of its retail footprint (524 ECs). Sales volumes jumped 67% YoY in Q2, highlighting strong demand recovery and effective distribution scaling.
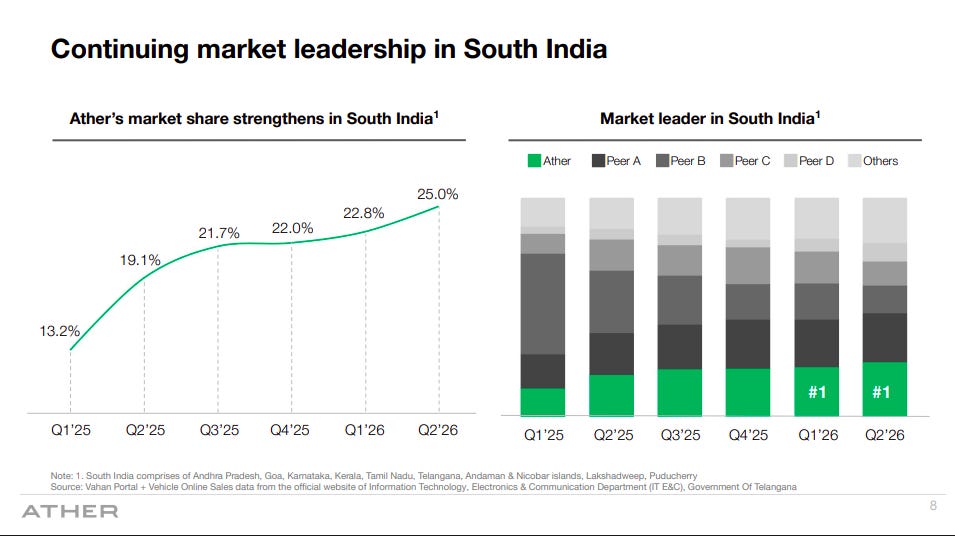
Ather has strengthened its leadership in South India, growing market share consistently from 13.2% in Q1’25 to 25% by Q2’26. The company has maintained the #1 position against all major peers, supported by strong regional brand pull and dominance in key southern states.
Retail
Trent | Large Cap | Retail
Trent operates retail formats like Westside, Zudio, Utsa, and Samoh, offering apparel, footwear, and accessories for men, women, and children. Westside focuses on exclusive brands and home decor, Zudio targets value retail, Utsa provides ethnic lifestyle products, and Samoh deals in luxurious ethnic wear.
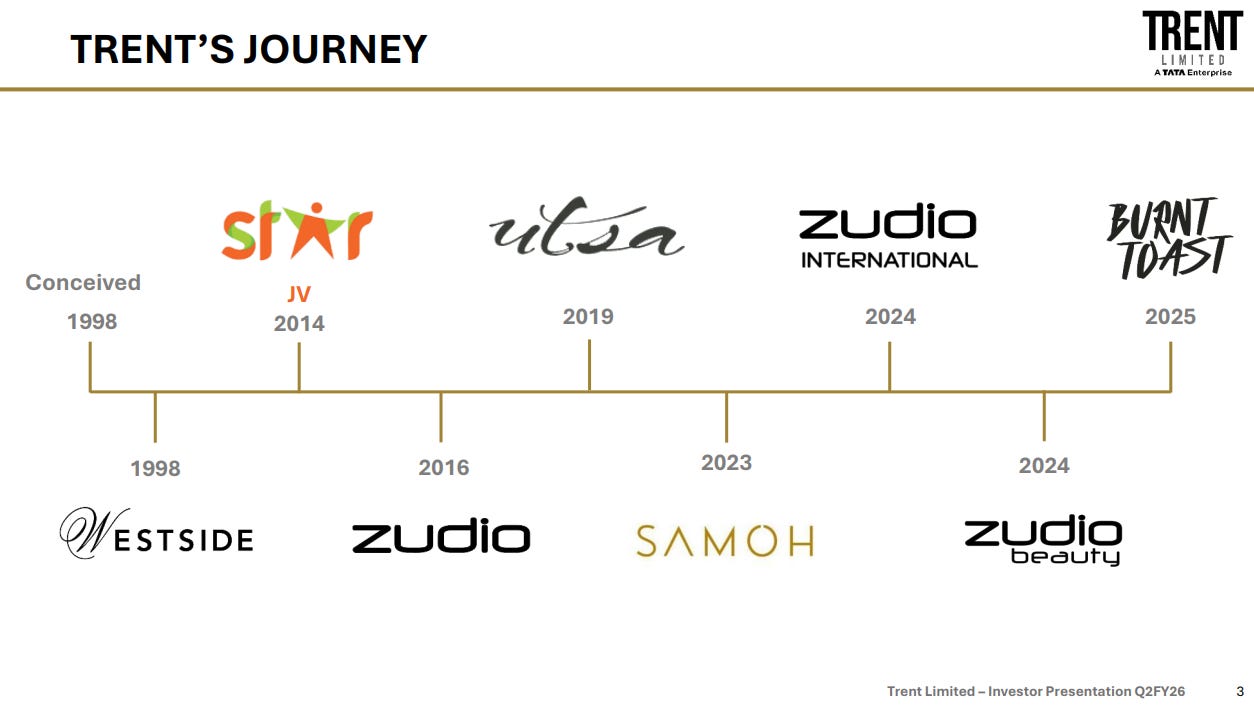
Trent’s brand portfolio has evolved systematically over nearly three decades. Westside launched in 1998, followed by Star (conceived 1998, JV 2014), Zudio (2016), Utsa (2019), Samoh (2023), Zudio Beauty (2024), and most recently Burnt Toast (2025). The timeline shows a deliberate expansion from department stores into value fashion, ethnic wear, beauty, and youth-focused segments.
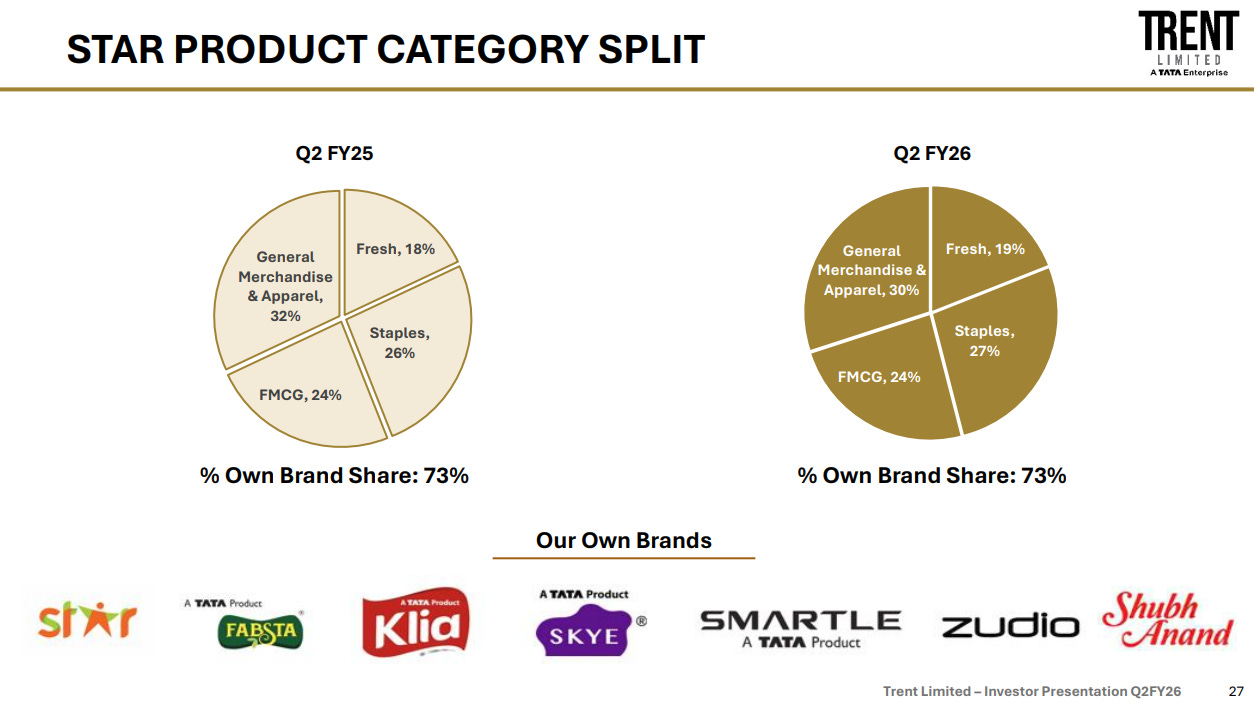
Star’s product mix remains consistent across Q2 FY25 and Q2 FY26: Fresh contributes 18-19%, Staples 26-27%, FMCG 24%, and General Merchandise & Apparel 30-32%. The own-brand share holds at 73% in both periods. Star’s private label portfolio includes brands like Farsta, Klia, Skye, and Smartle across food and non-food categories, reflecting a strong in-house brand ecosystem.
Swiggy | Mid Cap | Retail
Swiggy is a consumer-first technology company providing a convenient platform for ordering food, groceries, household items, making resITtaurant reservations, event bookings, product pick-up/drop-off services, and engaging in hyperlocal commerce activities.
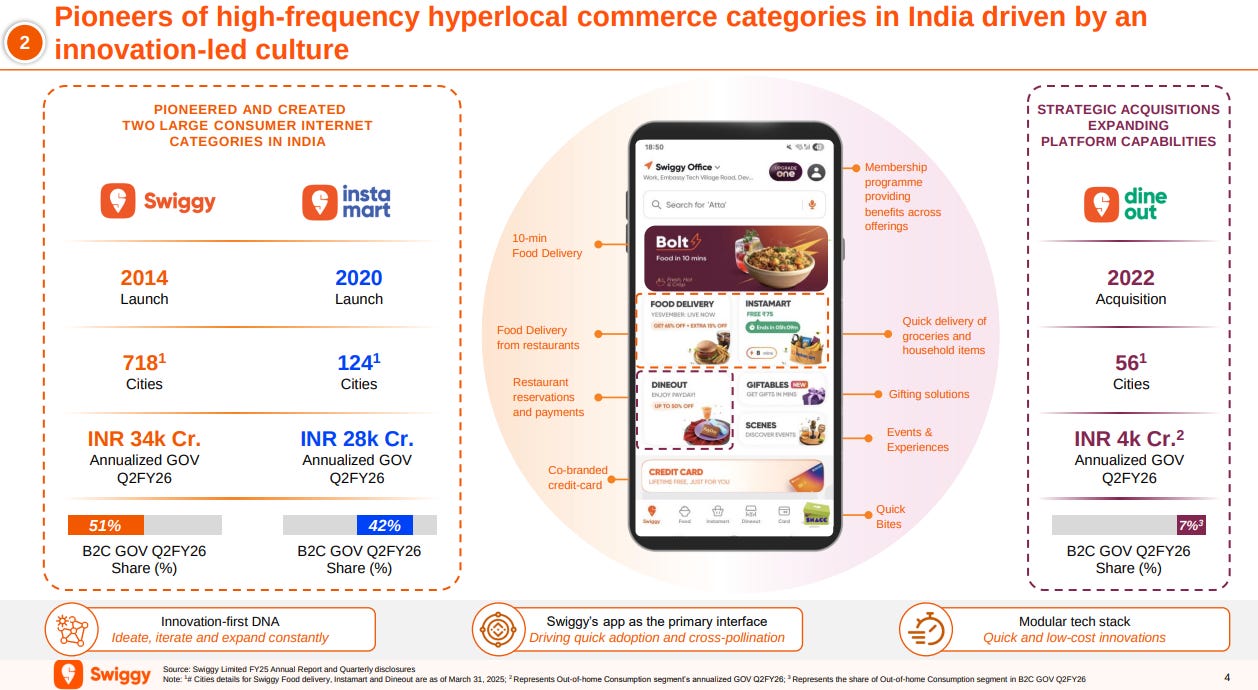
Swiggy has built two of India’s largest consumer internet categories—food delivery (launched 2014) and quick commerce via Instamart (launched 2020). Food delivery operates in 718 cities with an annualized GOV of ₹34,000 crore, while Instamart covers 124 cities with ₹28,000 crore in annualized GOV. The company has expanded through strategic acquisitions like Dineout and by launching innovations like Bolt (10-minute food delivery), co-branded credit cards, and gifting solutions, all powered by a modular tech stack that enables fast, low-cost experimentation.
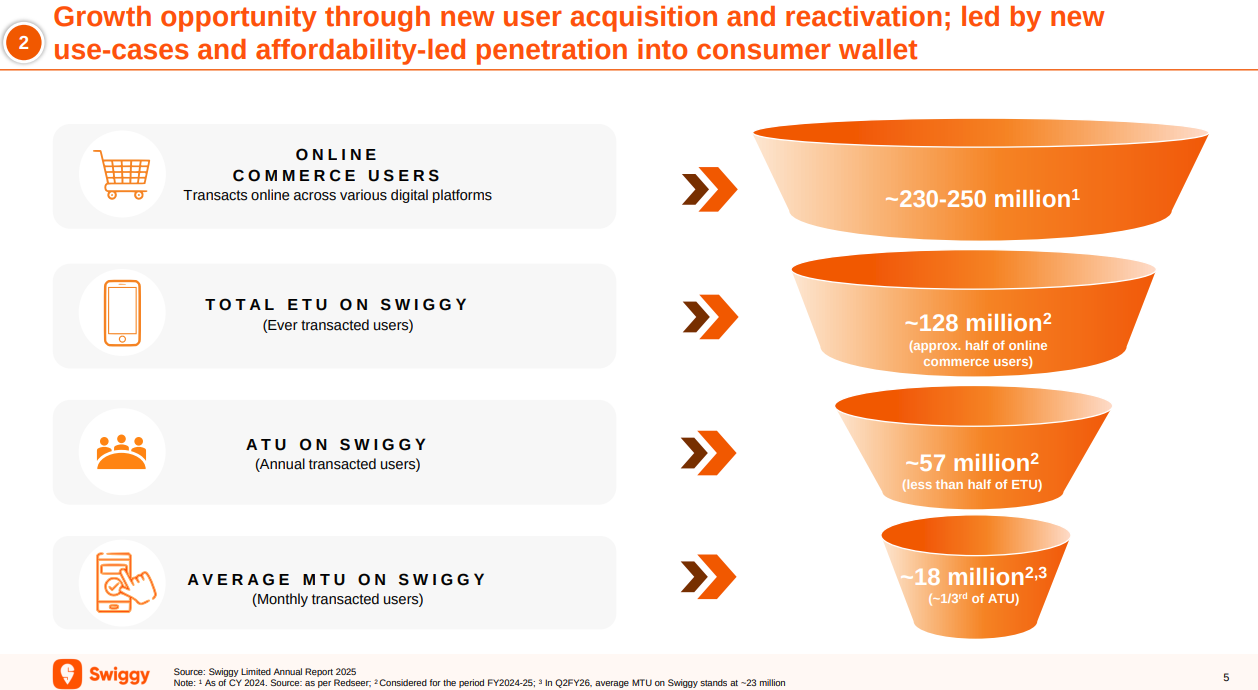
Swiggy has a massive growth runway, with only around 57 million annual transacting users out of 128 million who have ever used the platform, and just 18 million monthly active users. This represents less than half of the total addressable market of 230-250 million online commerce users in India. The company is focused on unlocking this potential through new use cases, affordability initiatives, and reactivating dormant users.
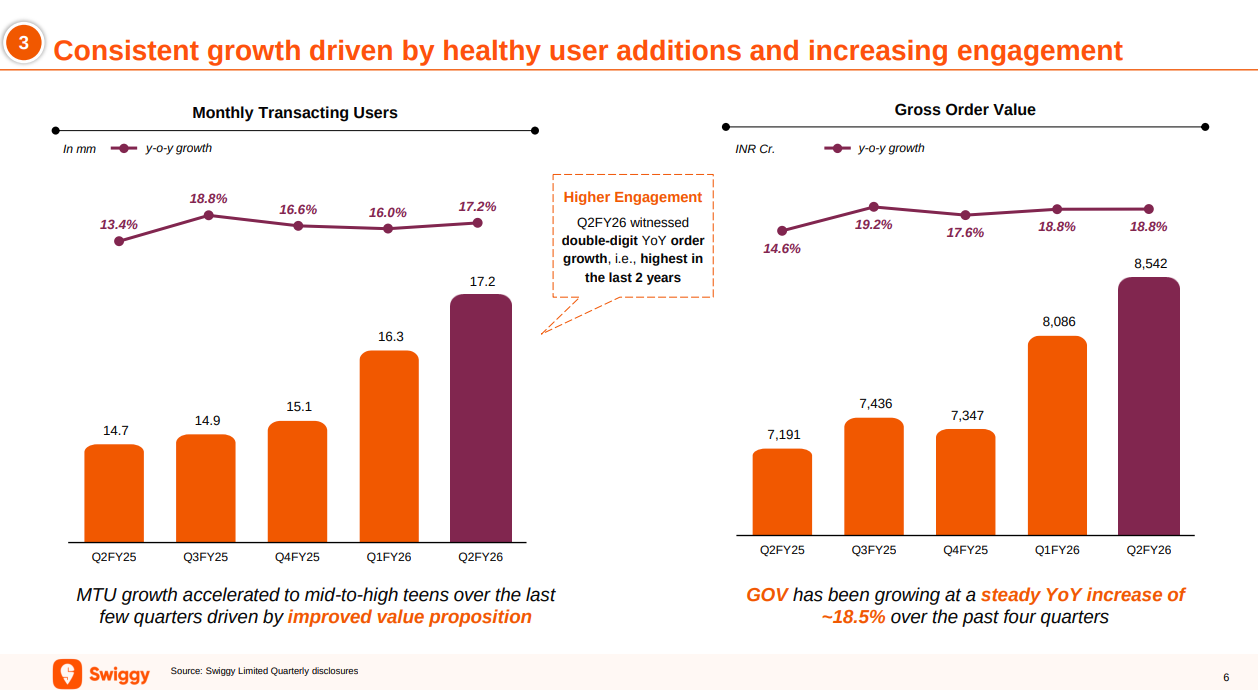
Swiggy’s food delivery business grew steadily in Q2 FY26, with monthly transacting users rising 17.2% year-on-year to 17.2 million and gross order value up 18.8% to ₹8,542 crore. The platform has seen its highest double-digit order growth in two years, driven by an improved value proposition and higher user engagement. GOV has been growing consistently at around 18.5% year-on-year over the past four quarters, reflecting healthy momentum across the board.
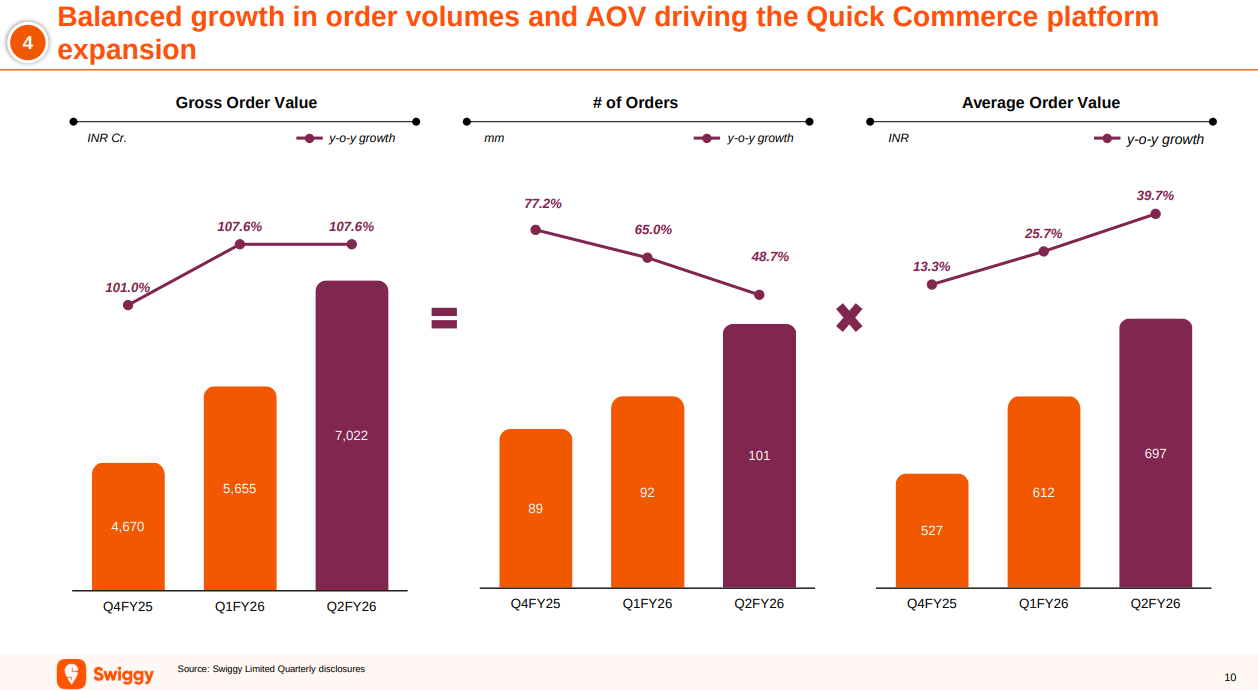
Instamart’s growth is being driven by both rising order volumes and increasing average order values. In Q2 FY26, GOV hit ₹7,022 crore (up 107.6% YoY), with the number of orders reaching 101 million (up 48.7% YoY) and AOV climbing to ₹697 (up 39.7% YoY). This balanced expansion across volume and basket size shows that the platform is successfully catering to a wider range of purchase missions while also deepening wallet share among existing users.
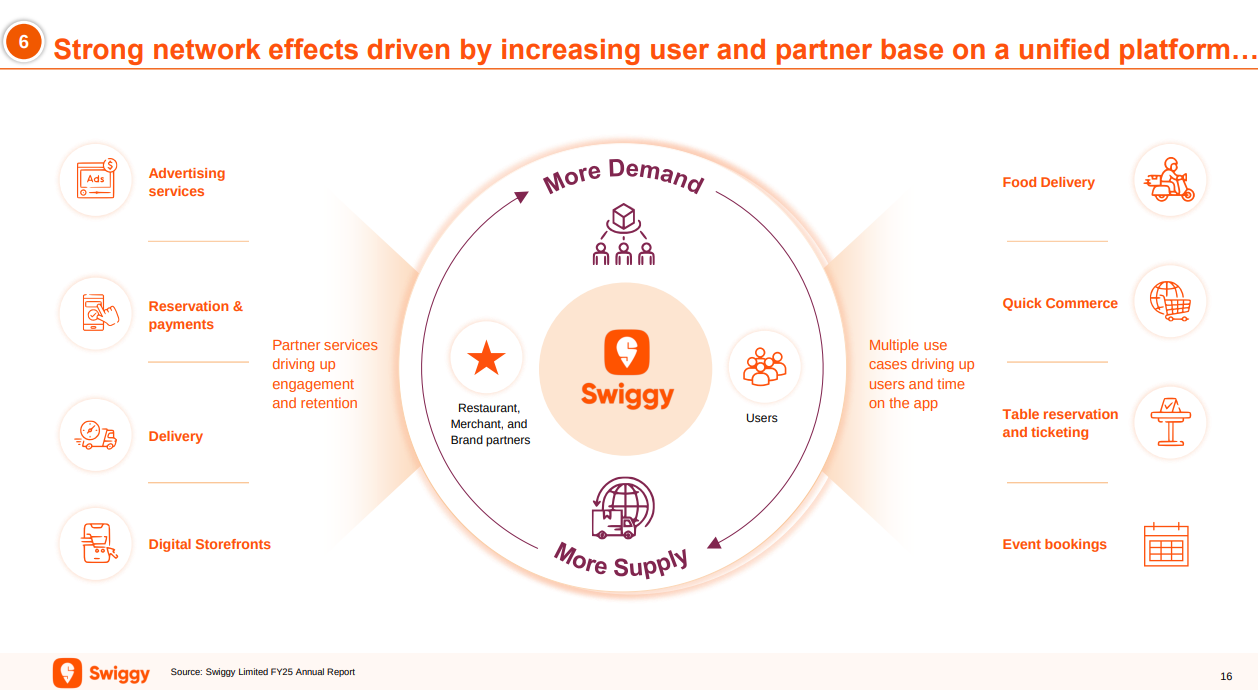
Swiggy’s platform creates powerful network effects by connecting users, restaurant partners, merchant partners, brand partners, and delivery partners across multiple services—food delivery, quick commerce, dining out, and events. More demand attracts more supply, which in turn drives higher engagement through advertising, reservations, digital storefronts, delivery services, and the Swiggy One membership program. This flywheel effect strengthens the platform’s value proposition for all stakeholders and fuels sustainable growth.
Metals
Hindalco | Large Cap | Metals
Hindalco Industries is a leading company in the aluminium and copper industries. It operates in multiple countries with a variety of established units. The company’s segments include Aluminium, producing hydrate, alumina, aluminum products, and Copper, manufacturing copper rods, cathodes, sulfuric acid, and other products. Hindalco is a major player in the global copper rod market and specializes in high-margin, high-growth specialty alumina products.
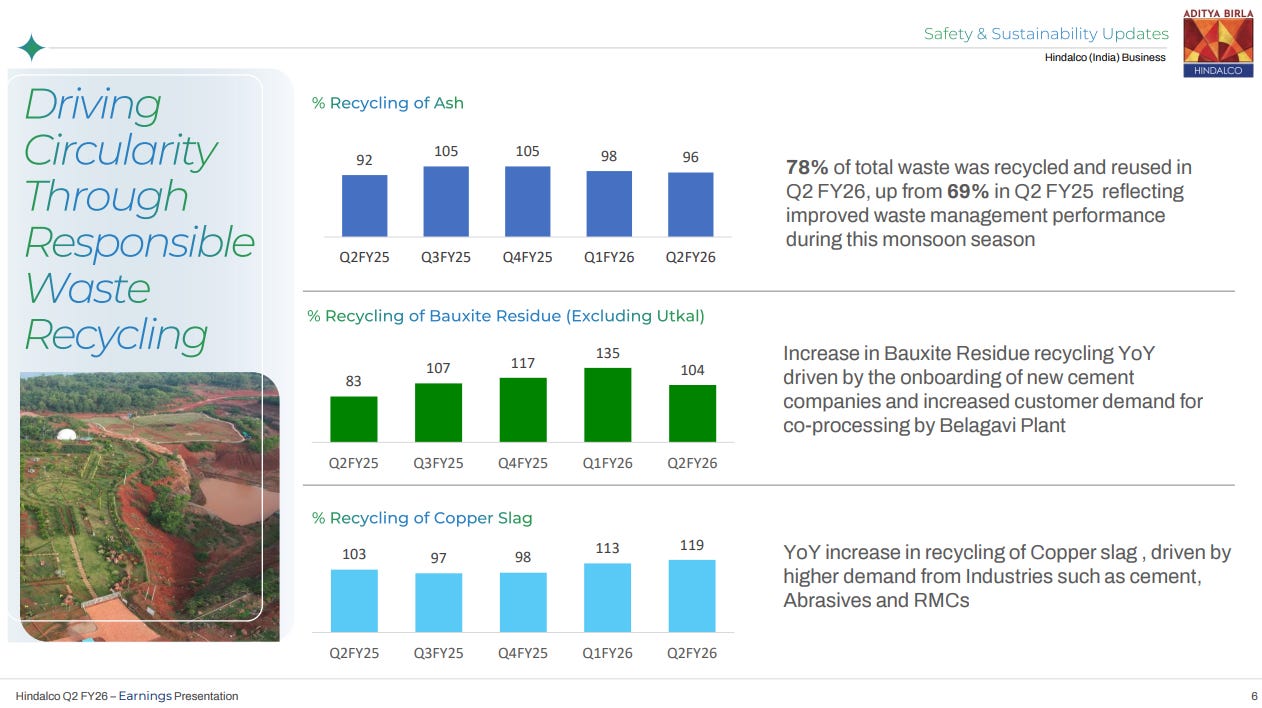
Hindalco achieved significant improvements in waste recycling across its operations in Q2 FY26. Overall, 78% of total waste was recycled and reused, up from 69% in Q2 FY25, reflecting improved waste management performance during the monsoon season. Ash recycling remained steady at 96% in Q2 FY26. Bauxite residue recycling (excluding Utkal) reached 104% in Q2 FY26, driven by onboarding new cement companies and increased customer demand for co-processing by the Belagavi Plant, though this was down from a peak of 135% in Q1 FY26. Copper slag recycling showed strong YoY growth, reaching 119% in Q2 FY26, up from 103% in Q2 FY25, driven by higher demand from industries such as cement, abrasives, and ready-mix concrete (RMCs).
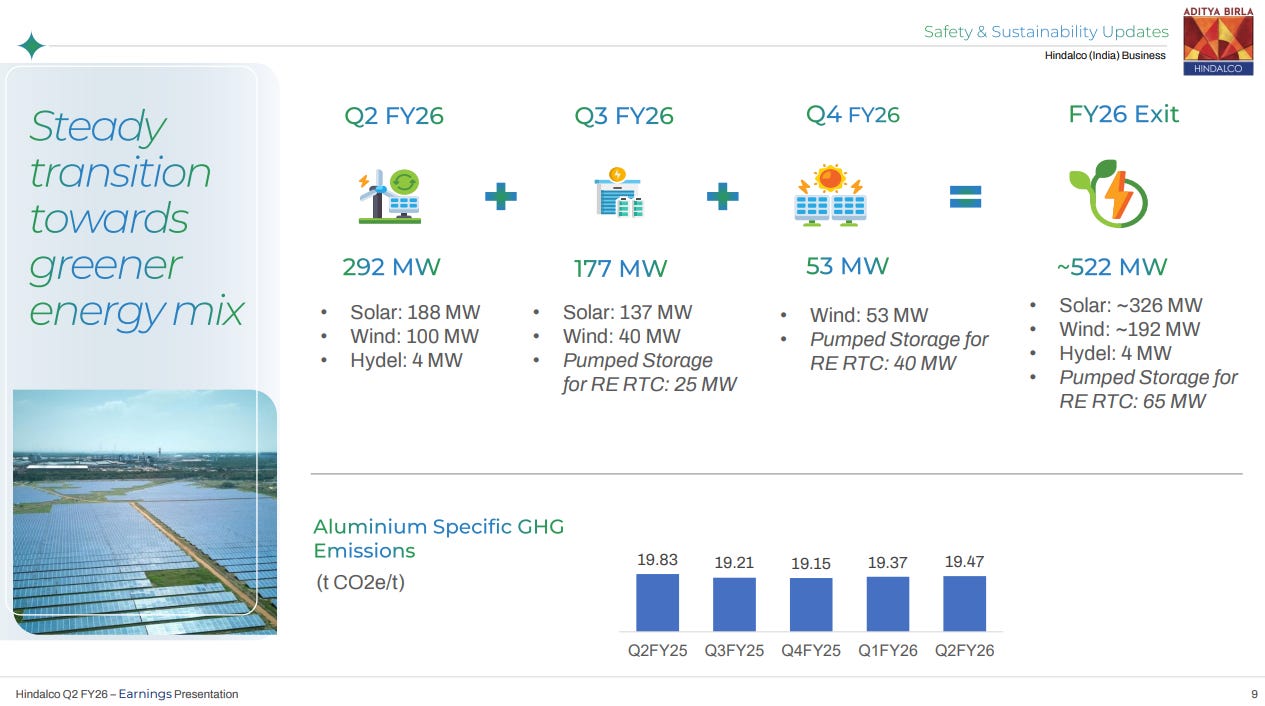
Hindalco is progressively adding renewable energy capacity throughout FY26. In Q2 FY26, the company added 292 MW (188 MW solar, 100 MW wind, 4 MW hydel). Q3 FY26 will see an additional 177 MW (137 MW solar, 40 MW wind, 25 MW pumped storage for RE RTC), followed by 53 MW wind and 40 MW pumped storage in Q4 FY26. By FY26 exit, total renewable capacity will reach approximately 522 MW. Aluminium-specific GHG emissions have remained relatively stable, ranging between 19.15 to 19.83 tonnes CO2e per tonne across the last five quarters.
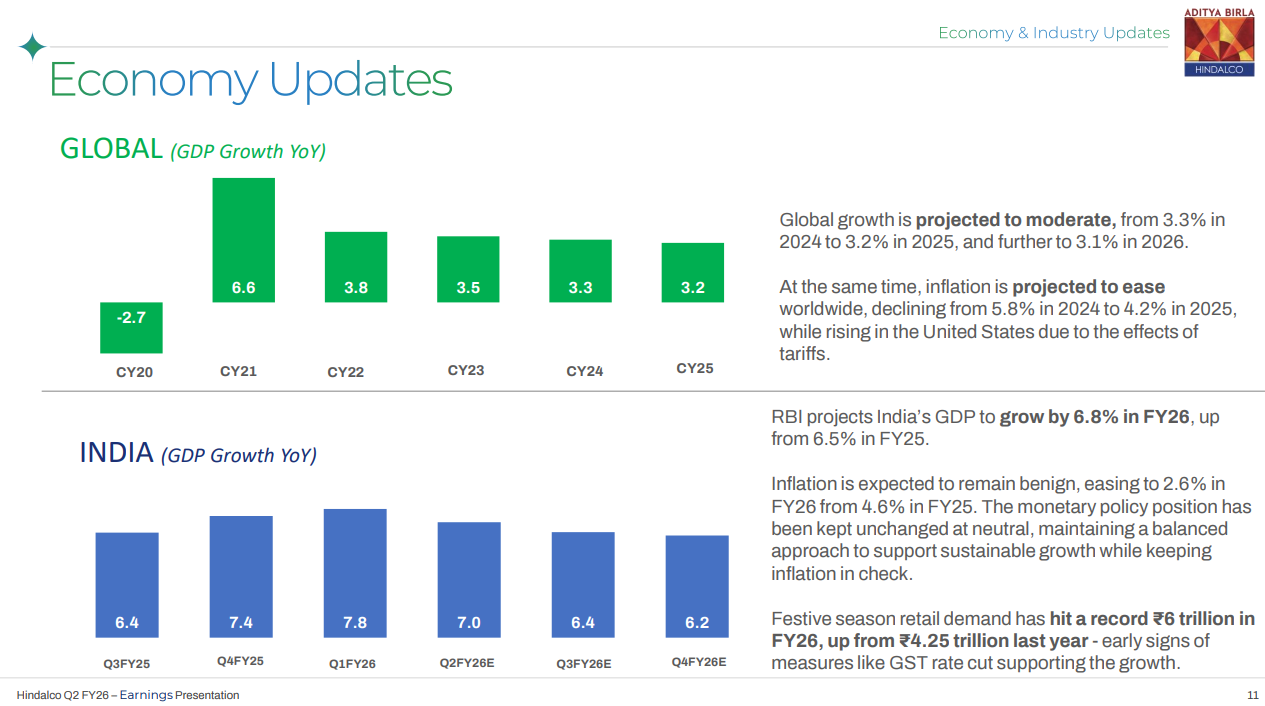
Global GDP growth is projected to moderate from 3.3% in 2024 to 3.2% in 2025 and 3.1% in 2026, while inflation is expected to ease from 5.8% in 2024 to 4.2% in 2025. India’s GDP is projected to grow 6.8% in FY26, up from 6.5% in FY25, with inflation easing to 2.6% from 4.6%. RBI maintains a neutral monetary policy stance. Festive season retail demand hit a record ₹6 trillion in FY26, up from ₹4.25 trillion last year, showing early signs of measures like GST rate cuts supporting growth.
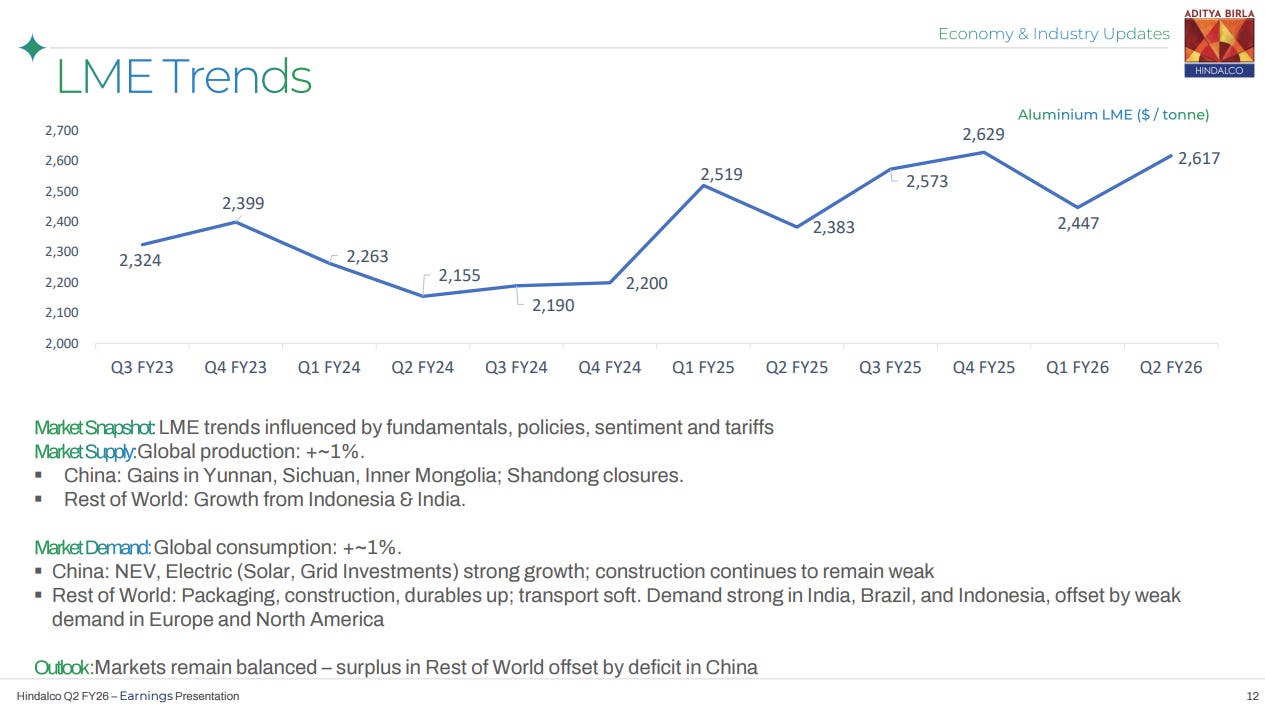
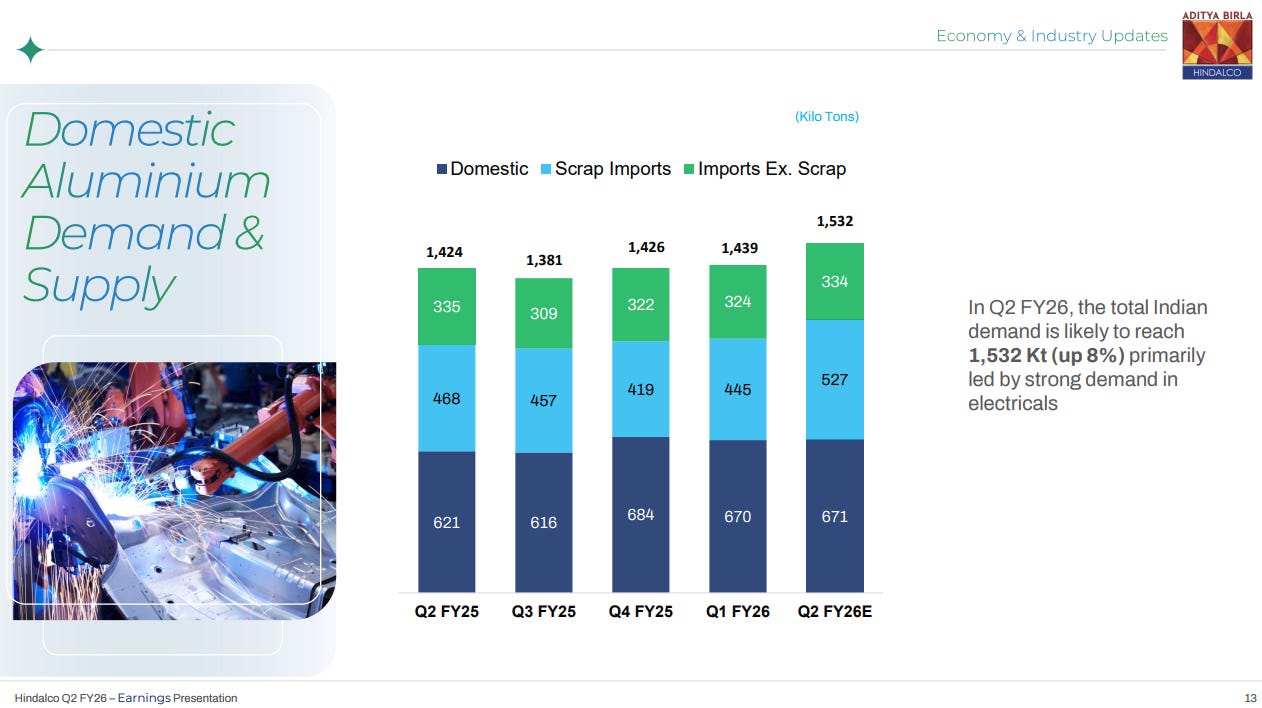
LME aluminium prices have fluctuated between $2,155 and $2,629 per tonne over recent quarters, influenced by fundamentals, policies, sentiment, and tariffs. Global production increased approximately 1%, with gains in China’s Yunnan, Sichuan, and Inner Mongolia offset by Shandong closures, plus growth from Indonesia and India. Global consumption also increased approximately 1%, with China showing strong growth in NEVs and electric (solar, grid investments) but weak construction, while the Rest of World saw packaging, construction, and durables growth. Markets remain balanced with Rest of World surplus offsetting China’s deficit.
Total Indian aluminium demand in Q2 FY26 is likely to reach 1,532 Kt, up 8% YoY, primarily driven by strong demand in electricals. The supply composition shows domestic production at 671 Kt, scrap imports at 527 Kt, and imports excluding scrap at 334 Kt. Compared to Q2 FY25, domestic production remained relatively stable while scrap imports increased significantly from 468 Kt to 527 Kt, reflecting evolving supply dynamics in the market.
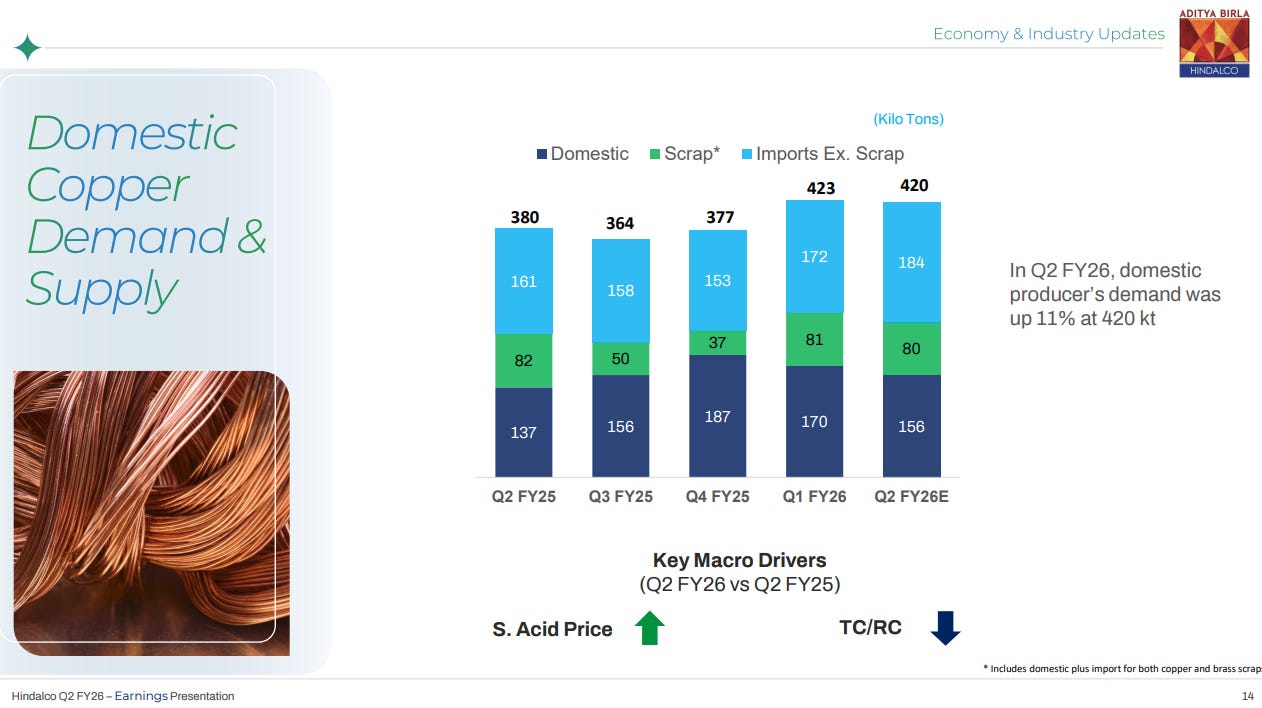
Domestic copper producer demand in Q2 FY26 was up 11% at 420 Kt. The supply mix included 156 Kt from domestic production, 80 Kt from scrap (including both copper and brass scraps), and 184 Kt from imports excluding scrap. Key macro drivers compared to Q2 FY25 showed sulphuric acid prices increasing while TC/RC (treatment charges/refining charges) decreased, reflecting changes in the copper smelting economics and feedstock availability.
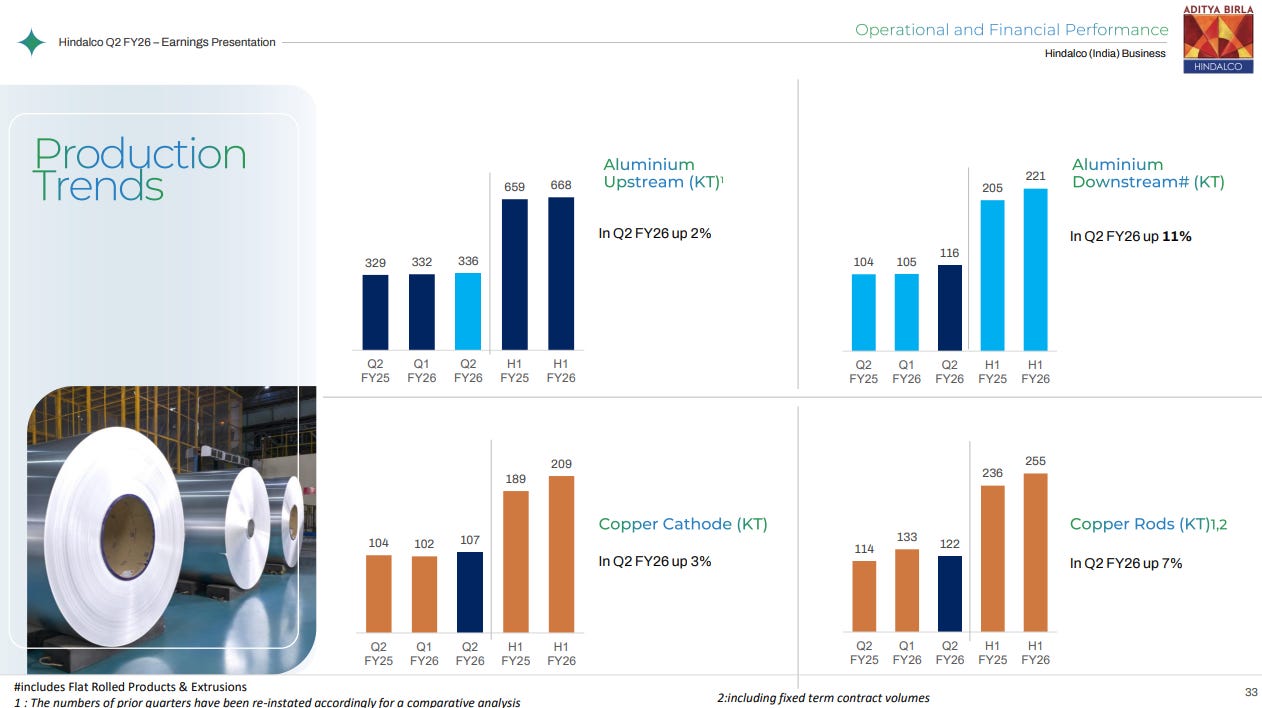
Aluminium upstream production in Q2 FY26 reached 336 Kt, up 2% YoY, while aluminium downstream production hit 116 Kt, up 11% YoY. Copper cathode production was 107 Kt, up 3% YoY, and copper rods production reached 122 Kt, up 7% YoY. For H1 FY26, aluminium upstream totaled 668 Kt, downstream reached 221 Kt, copper cathode was 209 Kt, and copper rods were 255 Kt. The consistent production growth across segments reflects Hindalco’s operational efficiency and capacity utilization improvements.
FMCG
Britannia Inds | Large Cap | FMCG
Britannia Industries is a prominent food products company in India, manufacturing popular brands like Good Day, Tiger, NutriChoice, Milk Bikis, and Marie Gold. Their diverse product portfolio consists of Biscuits, Bread, Cakes, Rusk, Cheese, Beverages, Milk, and Yoghurt, making them a household name.
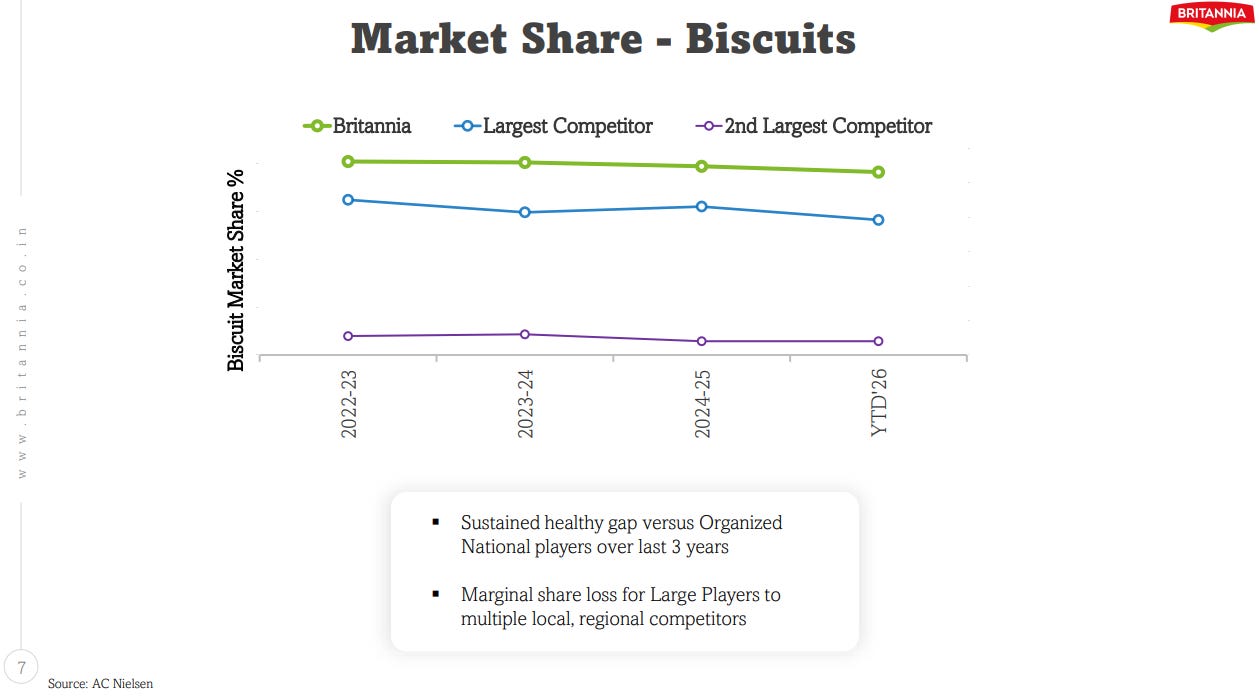
Britannia has maintained a healthy lead over its two largest organized competitors in the biscuit market over the past three years. The chart shows Britannia’s market share staying steady while its biggest rival has seen a slight decline, and the second-largest competitor has remained relatively flat. The slide notes that large players have lost some ground to smaller local and regional competitors, but Britannia has managed to hold its position consistently.
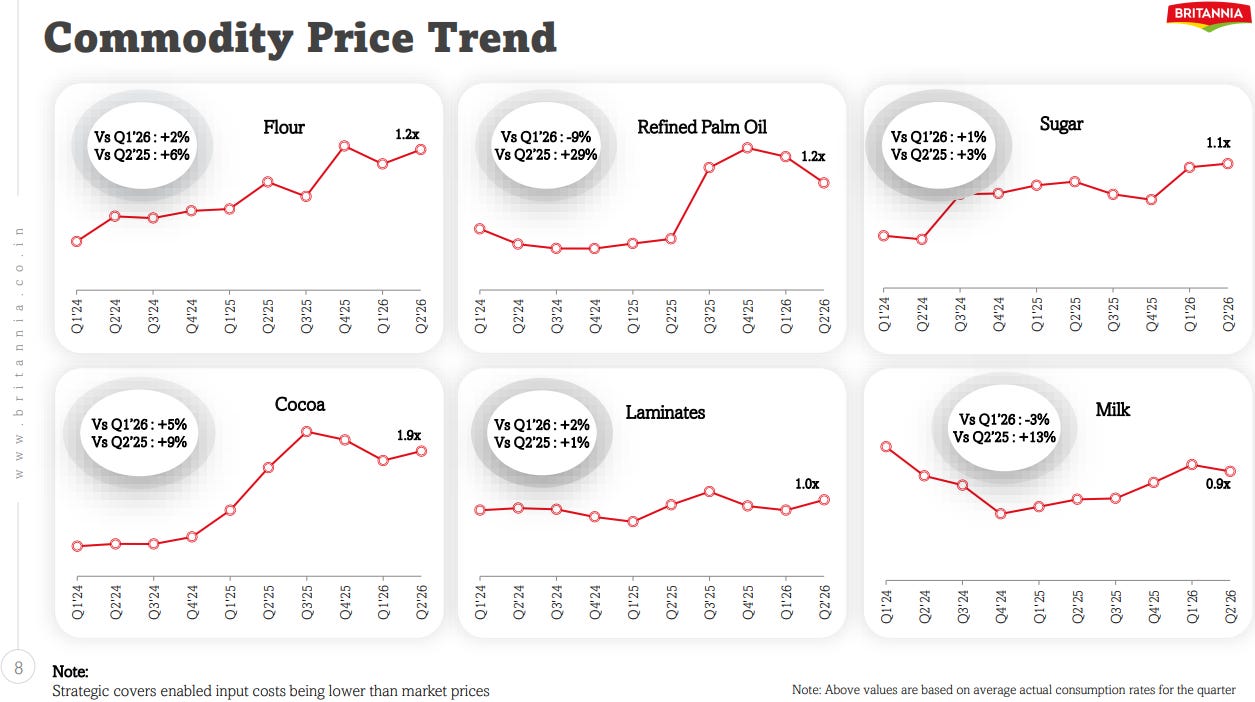
Six key raw materials—flour, refined palm oil, sugar, cocoa, laminates, and milk—are tracked across ten quarters from Q1 2024 to Q2 2026. Flour, cocoa, and laminates have seen moderate increases, while palm oil dropped recently but remains elevated compared to earlier periods. Sugar and milk show relatively stable trends with minor fluctuations, with quarter-over-quarter and year-over-year comparisons provided for each commodity.
Healthcare
Aarti Drugs | Small Cap | Health Care
Aarti Drugs Limited, is part of Aarti Group of Industries with a strong R&D Division in Maharashtra. The company manufactures APIs, Pharma Intermediates, Specialty Chemicals, and Formulations through its subsidiary. Its products range from Ciprofloxacin Hydrochloride to Benzene Sulphonyl Chloride.
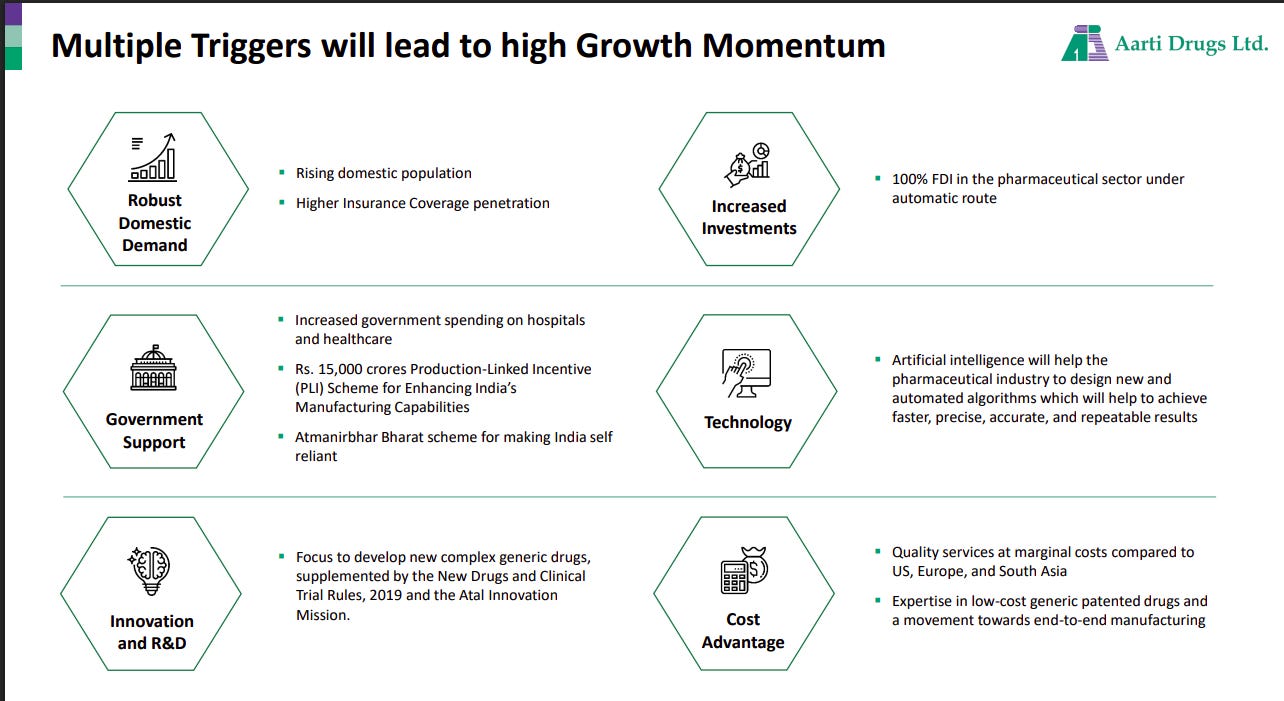
India’s pharma sector is set for multi-year growth, supported by rising domestic demand, higher insurance penetration, and increased government spending. Strong policy push (PLI, Atmanirbhar Bharat), tech adoption (AI), and focus on complex generics strengthen competitiveness. Cost advantages and global-standard manufacturing enhance long-term growth momentum
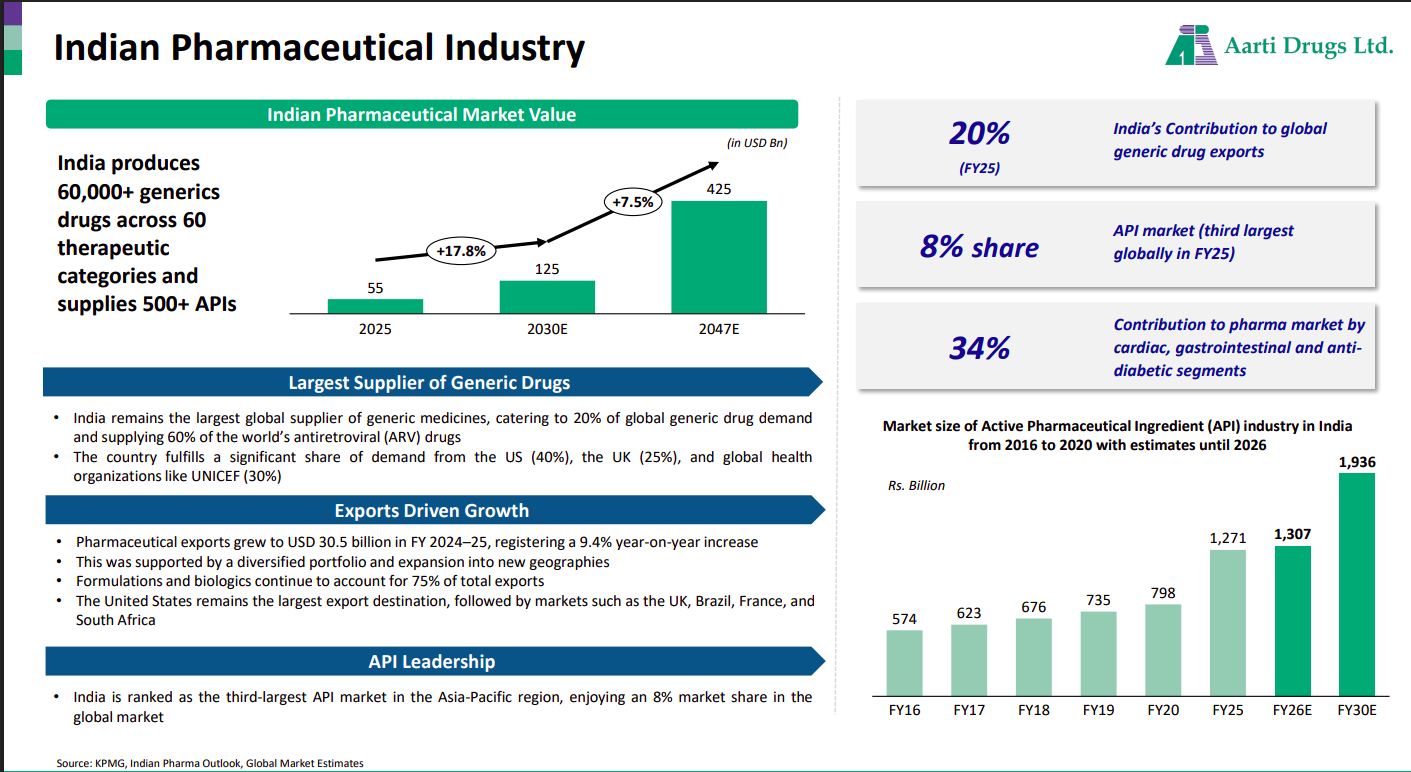
India remains the world’s largest supplier of generic drugs, contributing 20% to global exports and supplying over 500 APIs. Pharma market value is projected to grow significantly from USD 55 bn to USD 425 bn by 2047, driven by export-led expansion and leadership in cardiovascular, GI, and diabetes segments.
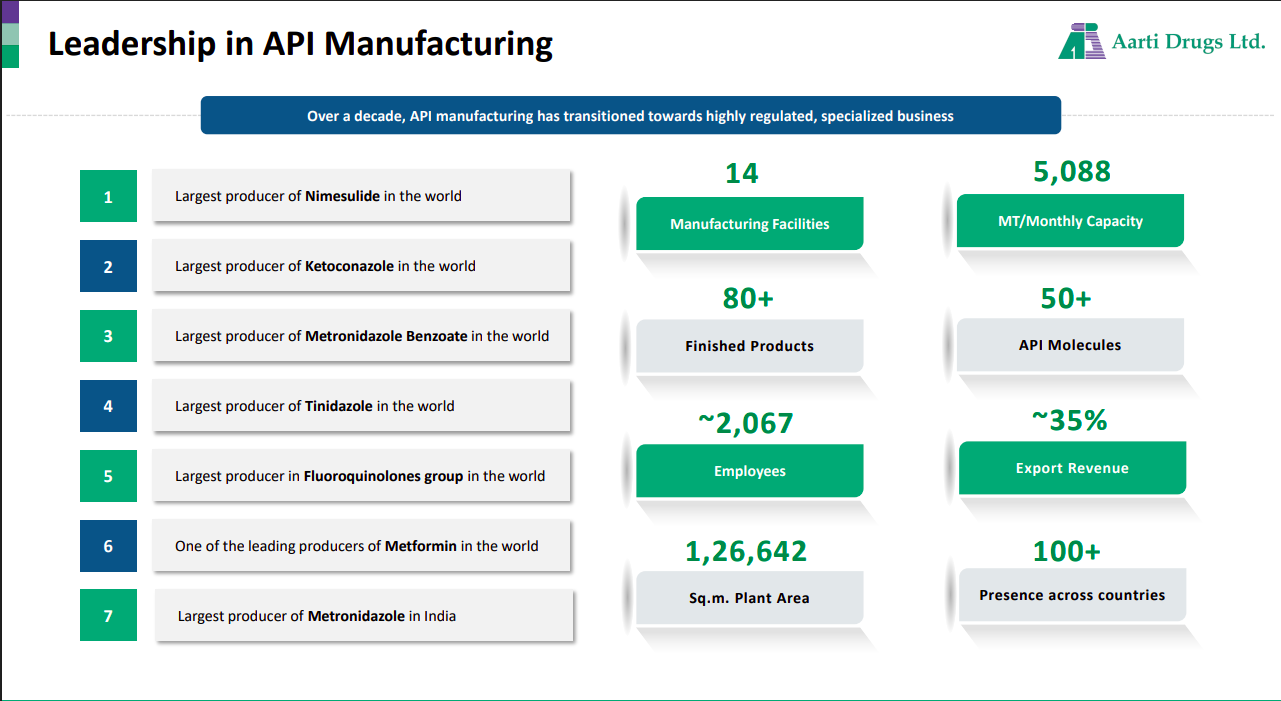
Aarti Drugs has established strong API leadership with world-leading production capacity across multiple molecules including Nimesulide, Ketoconazole, and Tinidazole. The company operates 14 facilities, manufactures 80+ finished products, and exports 35% of revenue to over 100 countries.
Apollo Hospital Ent. | Large Cap | Healthcare
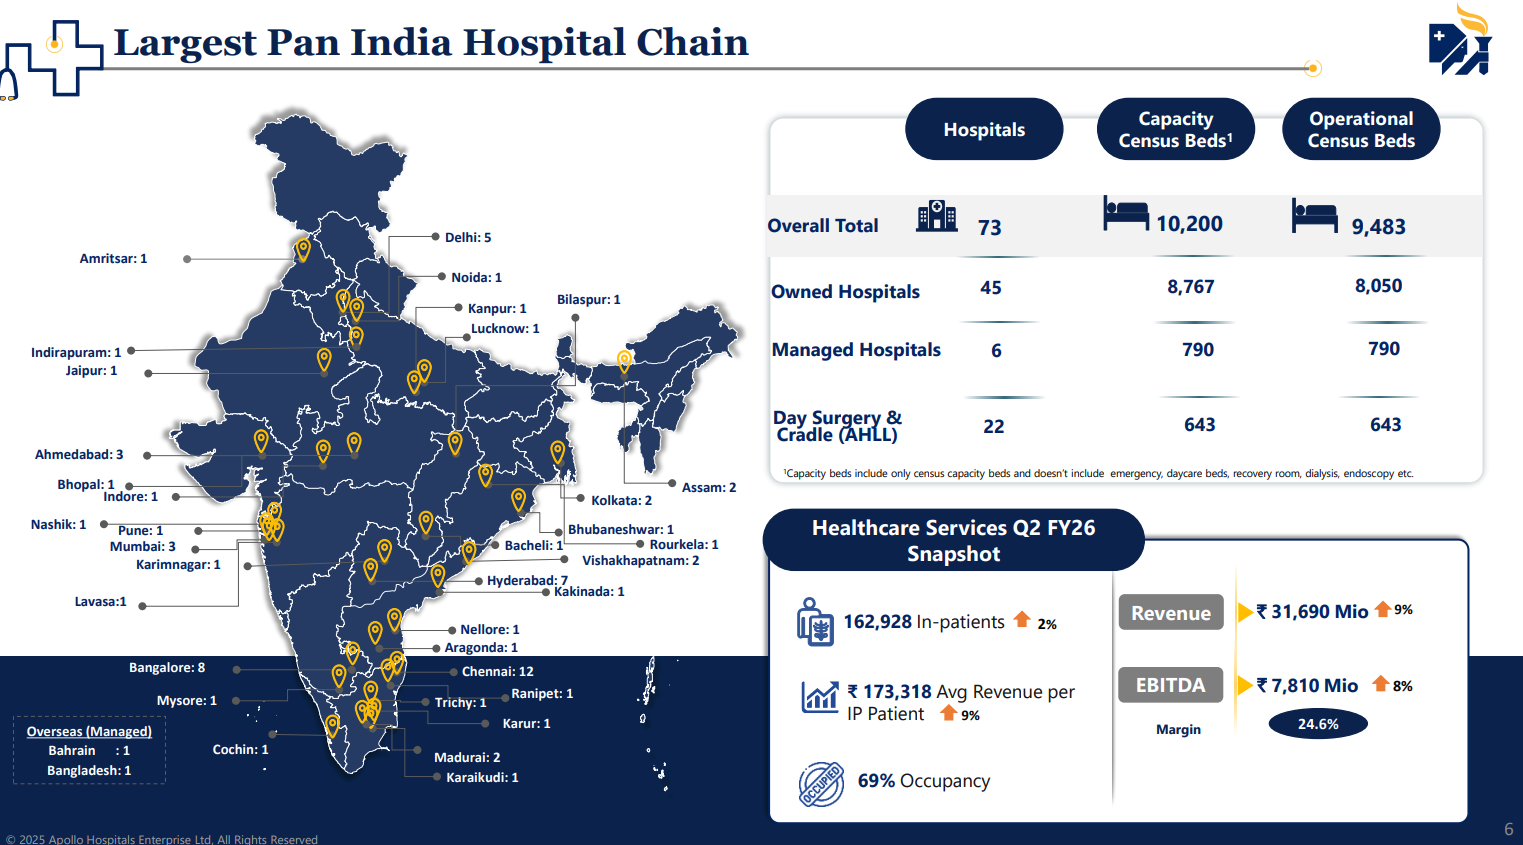
Apollo Hospitals Enterprise is a leading integrated healthcare provider in Asia, offering a comprehensive ecosystem including hospitals, pharmacies, clinics, and digital health platforms. It ensures quality healthcare accessibility across India with a widespread network catering to urban and remote areas, delivering consistent and compassionate care through advanced medical expertise.
Apollo Hospitals operates 73 facilities across India with a total capacity of 10,200 beds and 9,483 operational census beds. The network includes 45 owned hospitals, 6 managed hospitals, and 22 day surgery and cradle centers under AHLL. In Q2 FY26, the healthcare services segment generated ₹31,690 million in revenue with an EBITDA margin of 24.6%, serving 162,928 inpatients at 69% occupancy and an average revenue of ₹173,318 per inpatient.
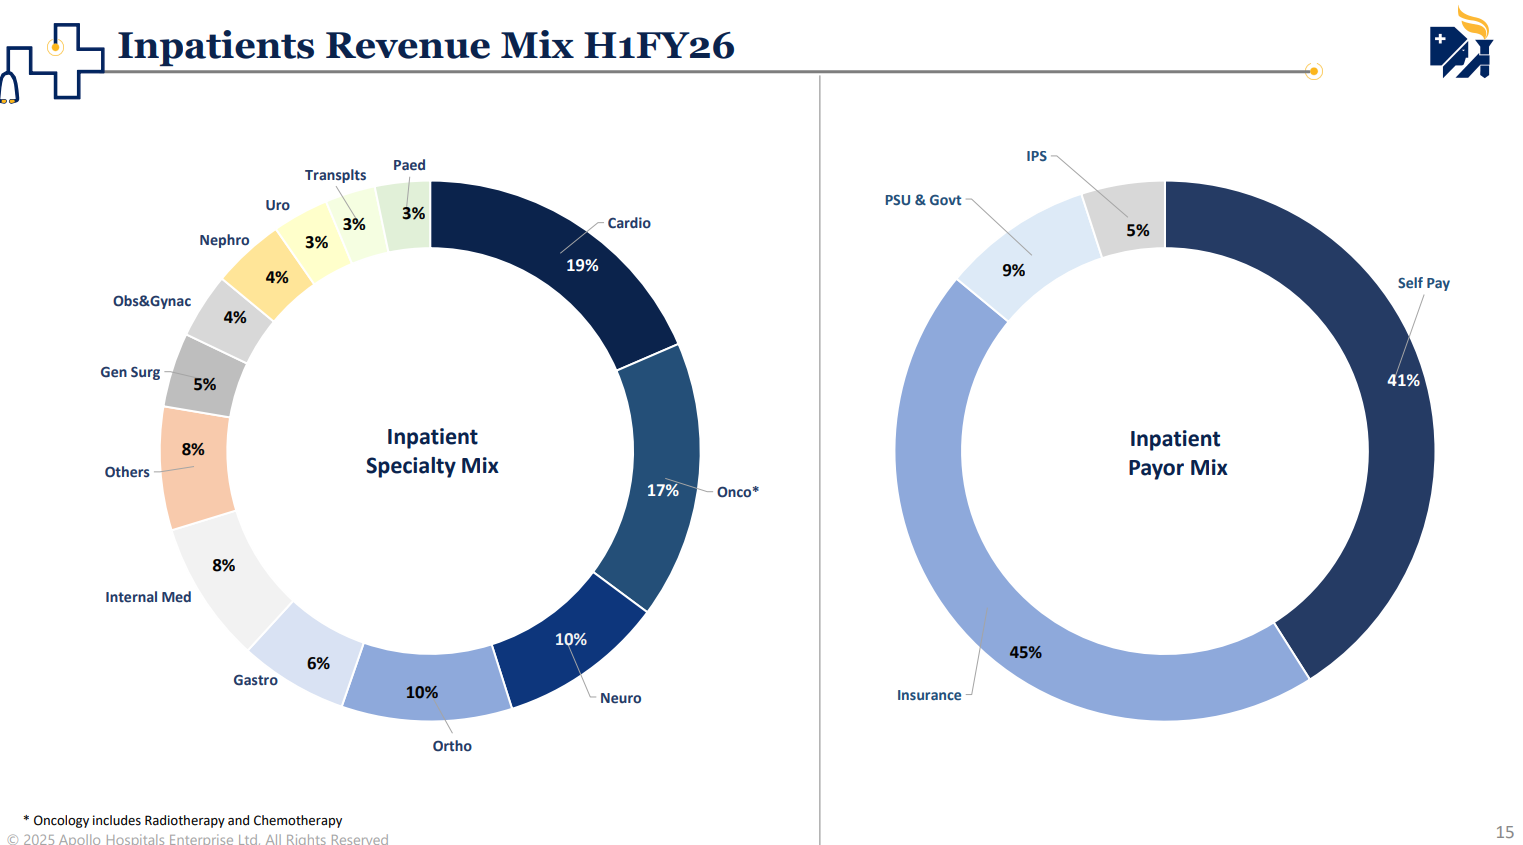
The inpatient specialty mix shows cardiology leading at 19%, followed by oncology at 17%, neurology at 10%, and orthopedics at 10%. Gastroenterology, internal medicine, and other specialties each contribute between 3-8%. The payor mix reveals that insurance accounts for 45% of inpatient revenue, self-pay patients contribute 41%, PSU and government schemes make up 9%, and international patient services represent 5%.
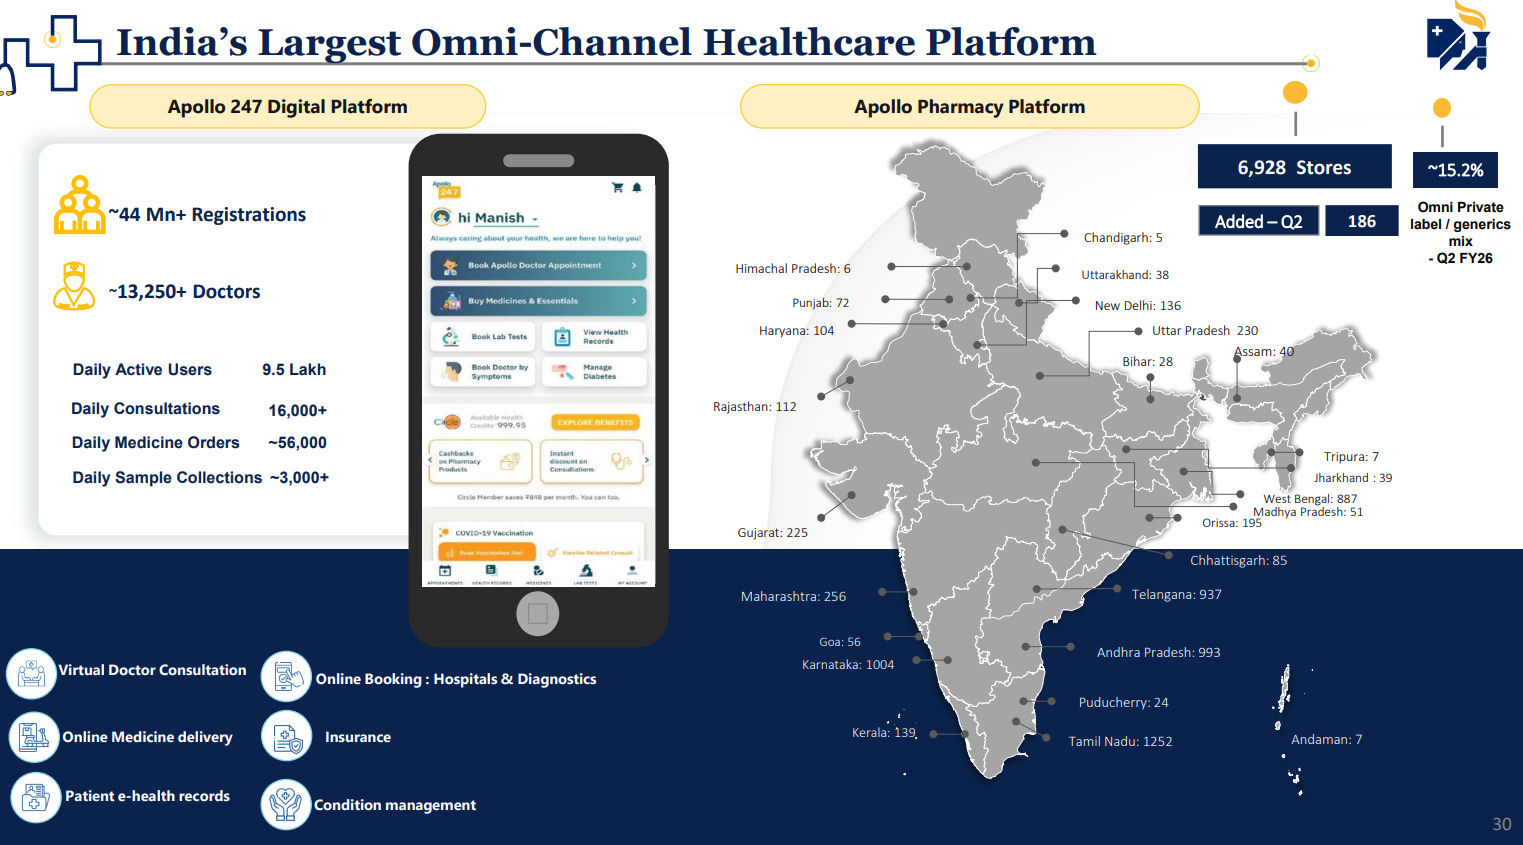
Apollo’s digital and physical healthcare platform serves over 44 million registered users with 9.5 lakh daily active users. The Apollo 24|7 app offers virtual consultations, online medicine delivery, diagnostics booking, and health records management. The pharmacy network spans 6,928 stores across India with approximately 15.2% private label and generic sales mix, processing around 56,000 daily medicine orders, 16,000+ consultations, and 3,000+ sample collections.
That’s it for now! Your feedback will really help shape how Points and Figures evolves. Drop it down in the comments below!
Quotes in this newsletter were curated by Meher, Kashish & Vignesh.
Disclaimer: We’ve used AI tools in filtering and cleaning up the quotes from the images so there maybe some mistakes. Now, if you are thinking why we are using AI, please remember that we are just a small team of 5 people running everything you see on Zerodha Markets 😬 So, all the good stuff is human and mistakes are AI.
We’re now on Reddit!
We love engaging with the perspectives of readers like you. So we asked ourselves - why not make a proper free-for-all forum where people can engage with us and each other? And what’s a better, nerdier place to do that than Reddit?
So, do join us on the subreddit, chat all things markets and finance, tell us what you like about our content and where we can improve! Here’s the link — alternatively, you can search r/marketsbyzerodha on Reddit.
See you there!
Points and Figures is run by the same team that creates The Daily Brief and Aftermarket Report.