


Sometimes, a single slide can explain more than a long report. Points and Figures is our way of breaking down what India’s leading companies are telling their shareholders and analysts. We comb through the decks, pull out the charts and data points that actually matter, and highlight the signals behind the numbers—whether about growth plans, margins, new markets, or risks on the horizon.
This is an extension of The Chatter. While The Chatter focuses on management commentary and earnings call transcripts, Points and Figures dives into investor presentations—and soon, even annual reports—to decode what companies are showing, not just what they’re saying.
We go through every major investor presentation so you don’t have to—bringing you the sharpest takeaways that reveal not just what the company is saying, but what it really means for the business, its sector, and the broader economy.
In this edition, we have covered 19 companies across 9 industries.
Engineering & Capital Goods
Waaree Energies
Vikram Solar
Atlanta Electric
Sterling and Wilson
FMCG
Heritage Foods
Ganesh Consumer Products
Chemicals
Anupam Rasayan
Software Services
Aurum Proptech
Building Materials
UltraTech Cement
India Cements
Media & Entertainment
PVR INOX Limited
Metals
Hindustan Zinc
JSW Steel
EPack Prefab Technologies Ltd.
Financial Services
IDFC First Bank
Federal Bank
UCO Bank
Bank of Maharashtra
Real Estate
Sobha
Engineering & Capital Goods
Waaree Energies | Mid Cap | Engineering & Capital Goods
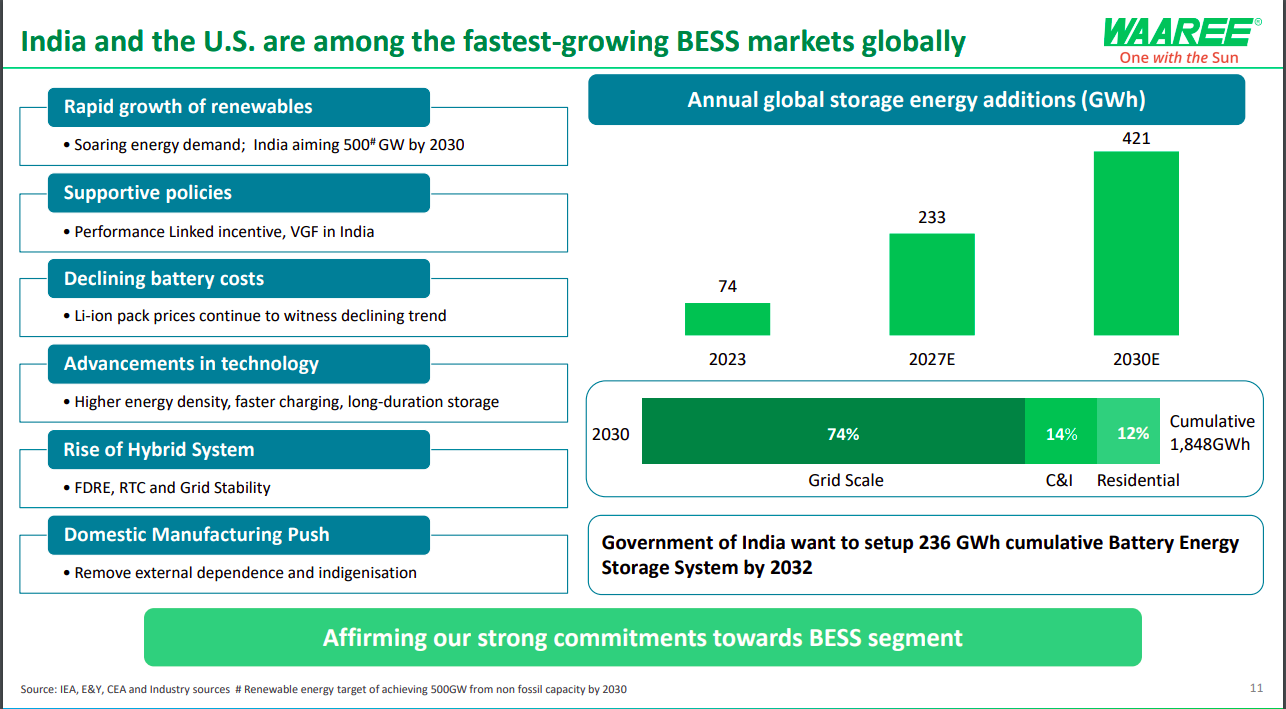
India and the U.S. are among the fastest-growing Battery Energy Storage System (BESS) markets, driven by renewable expansion, supportive policies, falling battery costs, and domestic manufacturing push. Global storage additions are expected to rise from 74 GWh in 2023 to 421 GWh by 2030, with grid-scale systems forming 74% of the total. India plans to install 236 GWh of cumulative BESS capacity by 2032.
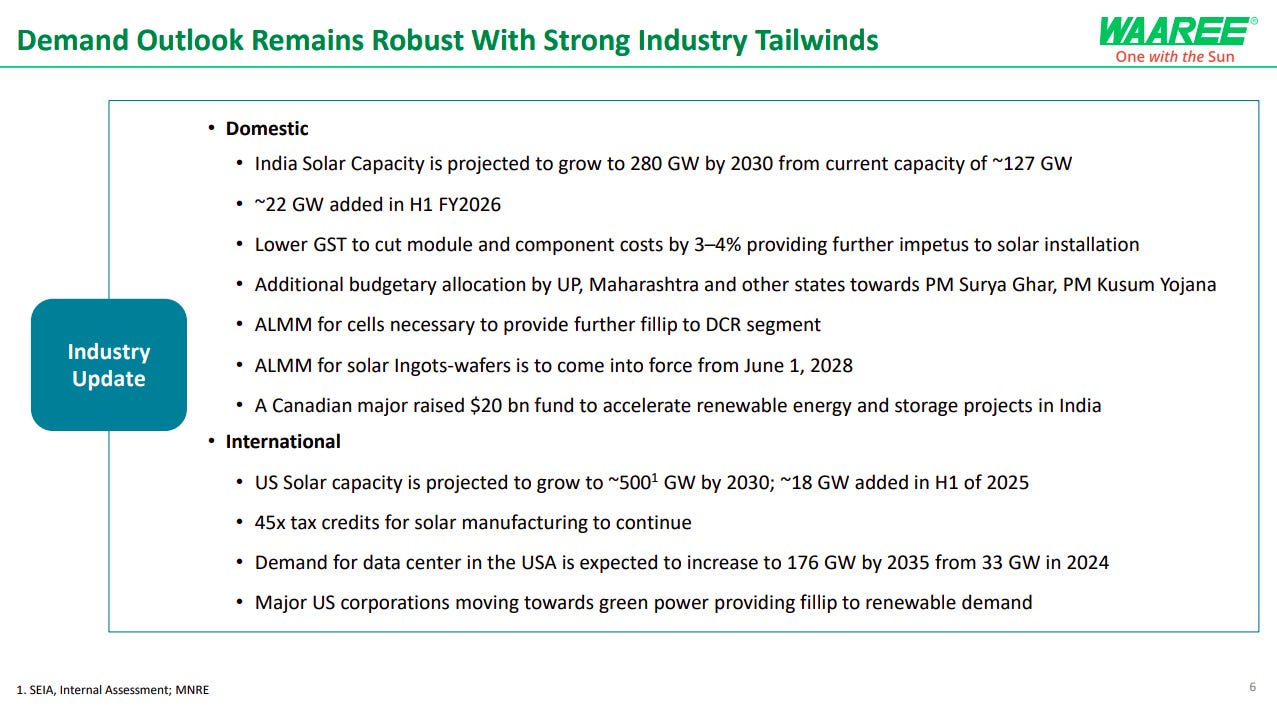
Solar demand remains strong with India’s capacity projected to reach 280 GW by 2030, aided by GST cuts, policy incentives, and state schemes. Internationally, U.S. solar capacity is expected to touch 500 GW by 2030, supported by tax credits and corporate green energy adoption, alongside rising power needs from expanding data centers.
Vikram Solar | Small Cap | Engineering & Capital Goods
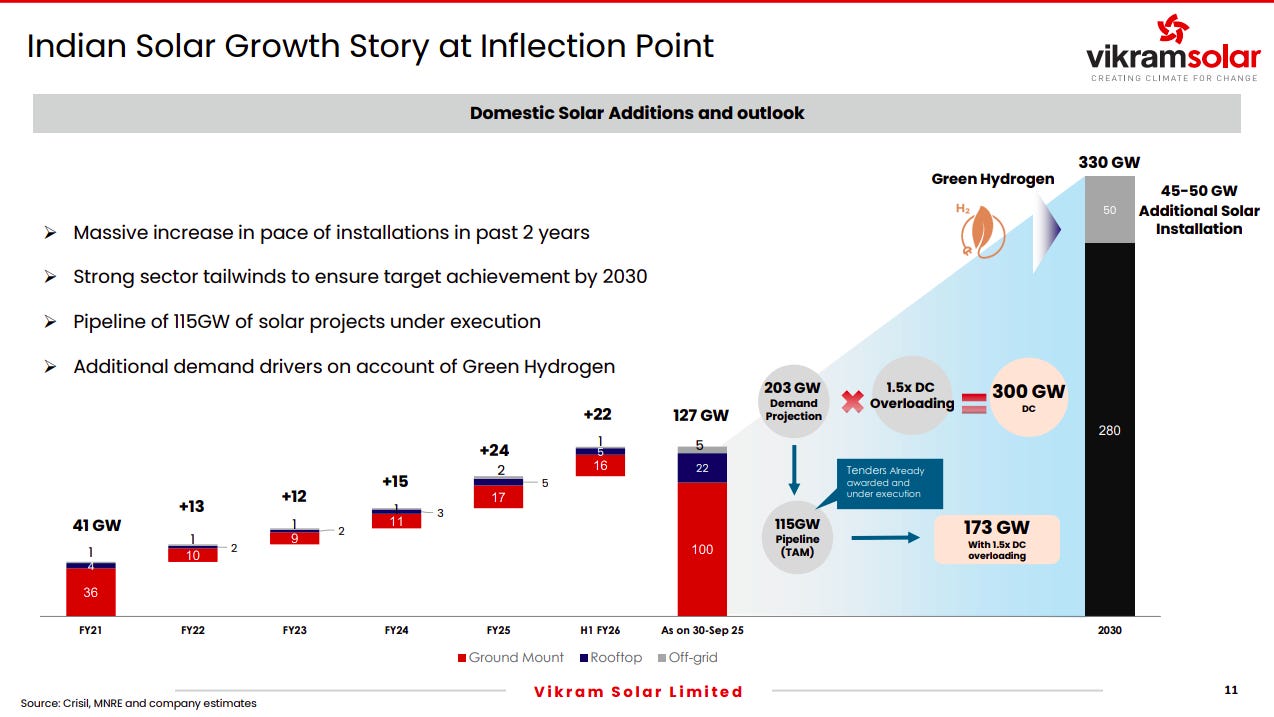
India’s solar sector is at a major inflection point, driven by record installations and accelerating clean energy targets. The country has already reached 127 GW of solar capacity (as of Sept 2025), with a pipeline of 115 GW under execution. Total demand is projected to reach 203 GW, which expands to nearly 300 GW DC when accounting for 1.5× DC overloading.
Strong policy tailwinds, such as Green Hydrogen initiatives, are expected to add another 45–50 GW of demand, taking the total solar opportunity to ~330 GW by 2030. Ground-mount installations dominate, while rooftop and off-grid segments continue steady growth—reflecting India’s expanding commitment to energy transition and industrial decarbonization.
Atlanta Electric | Micro Cap | Engineering & Capital Goods
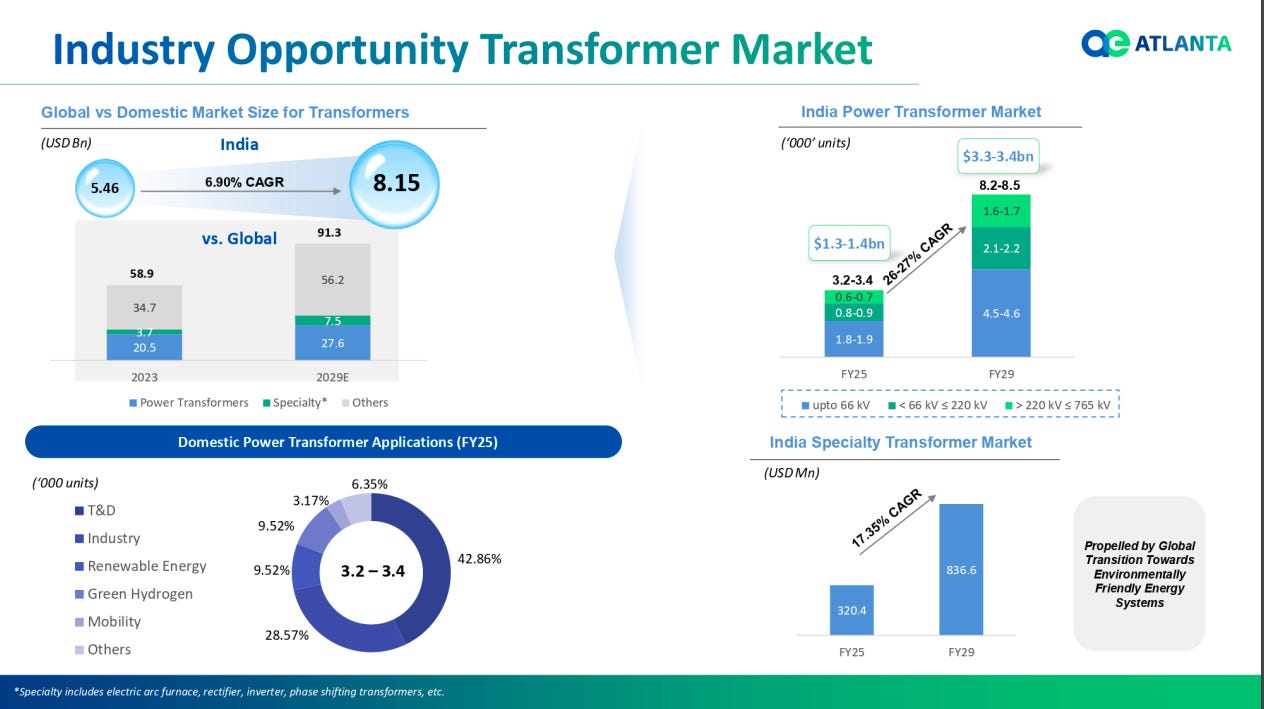
India’s transformer market is set to grow from USD 5.46 billion in 2023 to USD 8.15 billion by 2029, registering a 6.9% CAGR, driven by strong demand across transmission & distribution, renewable energy, and industrial sectors. The power transformer segment alone is projected to expand at 26–27% CAGR, from USD 1.3–1.4 billion (FY25) to USD 3.3–3.4 billion (FY29). Meanwhile, the specialty transformer market is expected to more than double from USD 320 million to USD 836 million, aided by the global shift toward environmentally friendly energy systems.
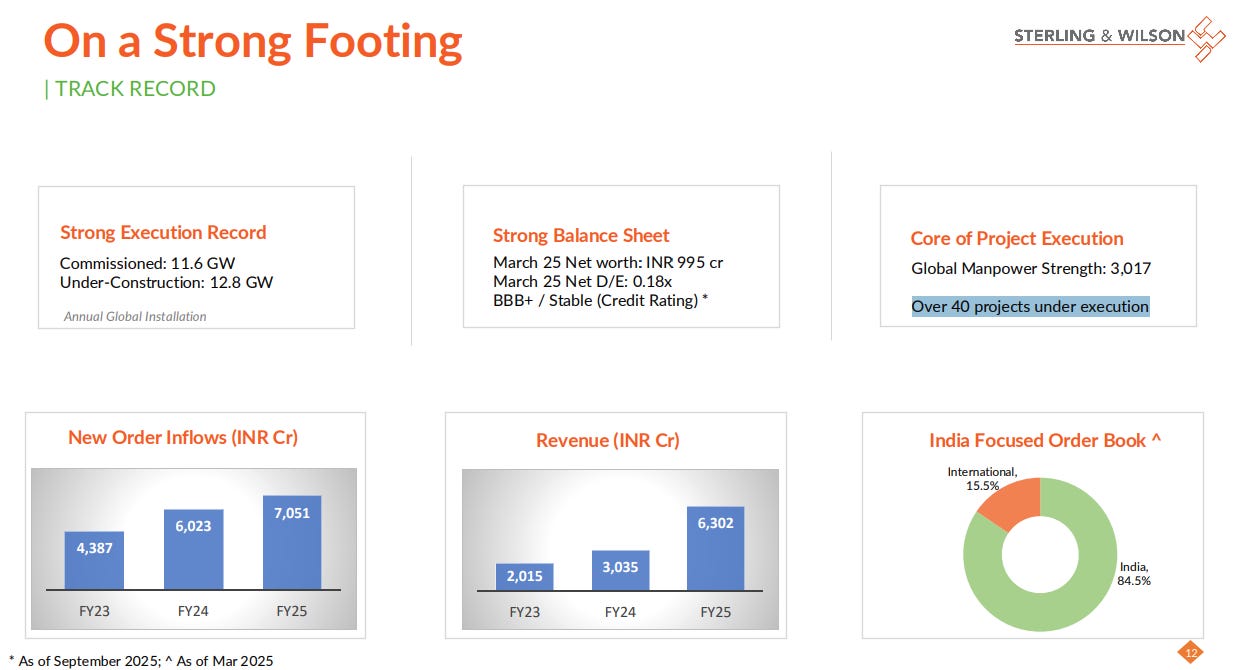
Sterling and Wilson | Small Cap | Engineering & Capital Goods
Sterling & Wilson’s track record shows strong momentum across execution, balance sheet, and order book. The company has commissioned 11.6 GW of projects with another 12.8 GW under construction, while maintaining a healthy balance sheet with a net worth of ₹995 crore and a BBB+/Stable credit rating. New order inflows have surged from ₹4,387 crore in FY23 to ₹7,051 crore in FY25, driving revenue up to ₹6,302 crore. With a global manpower strength of 3,017 and over 40 projects under execution, the company’s order book remains heavily India-focused at 84.5%, with international orders making up the remaining 15.5%.
FMCG
Heritage Foods | Small Cap | FMCG
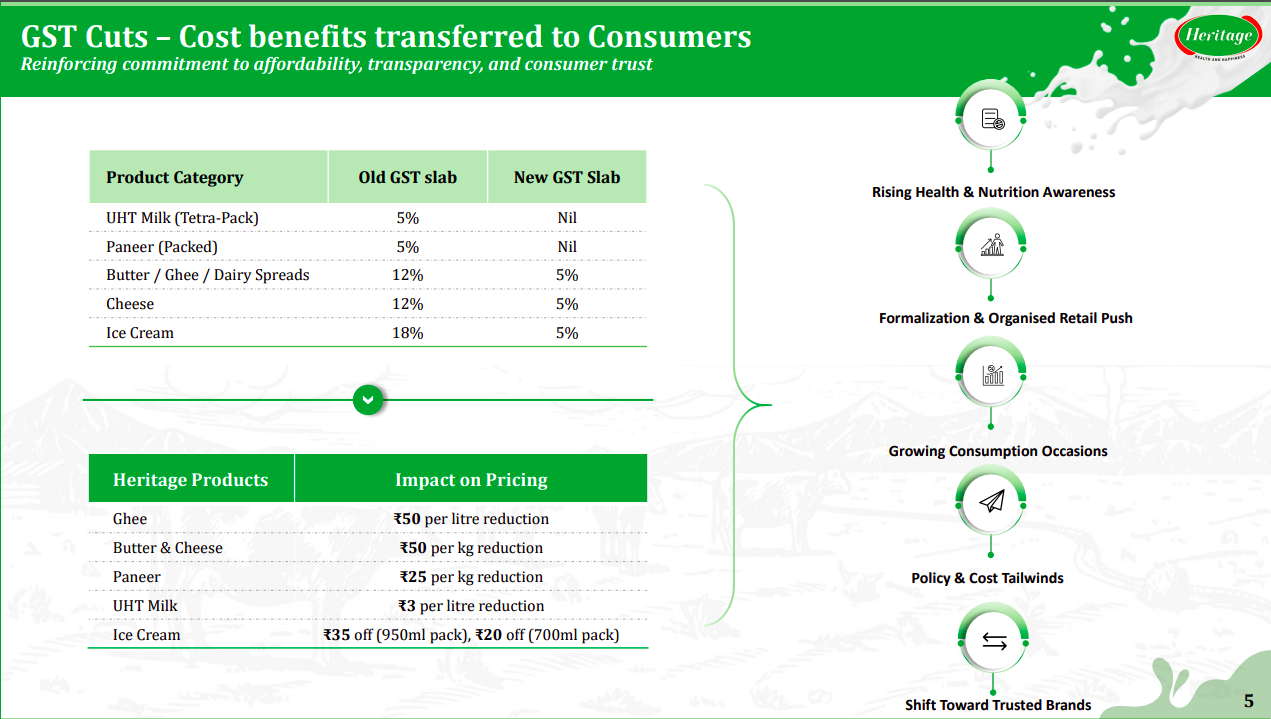
Recent GST reductions—from 12–18% to 5% or nil across dairy categories like butter, cheese, paneer, and ice cream—have lowered Heritage’s product prices by ₹20–₹50. These cuts, along with rising health awareness and retail formalization, are expected to boost demand and reinforce consumer trust in organized dairy brands.
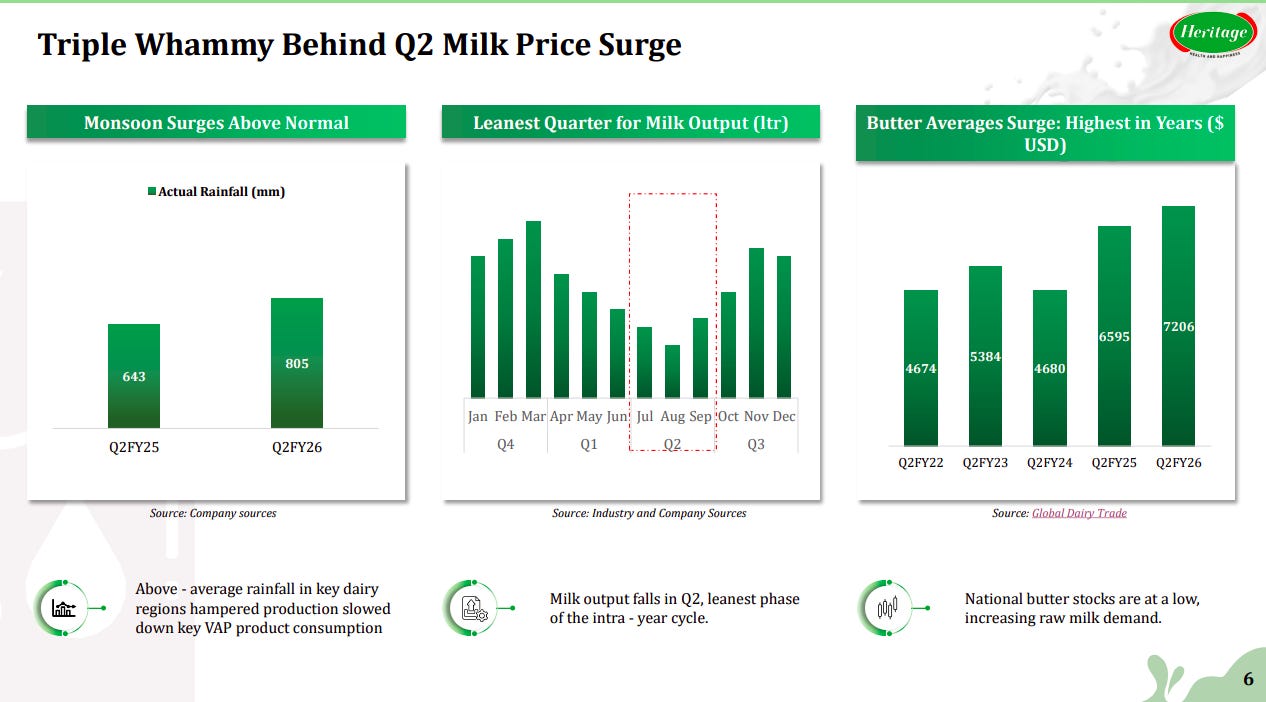
Above-normal rainfall in Q2FY26 (805 mm vs 643 mm last year) slowed dairy output during the leanest quarter for milk production. Simultaneously, global butter prices hit multi-year highs ($7,206/tonne), tightening supply and driving higher raw milk prices.
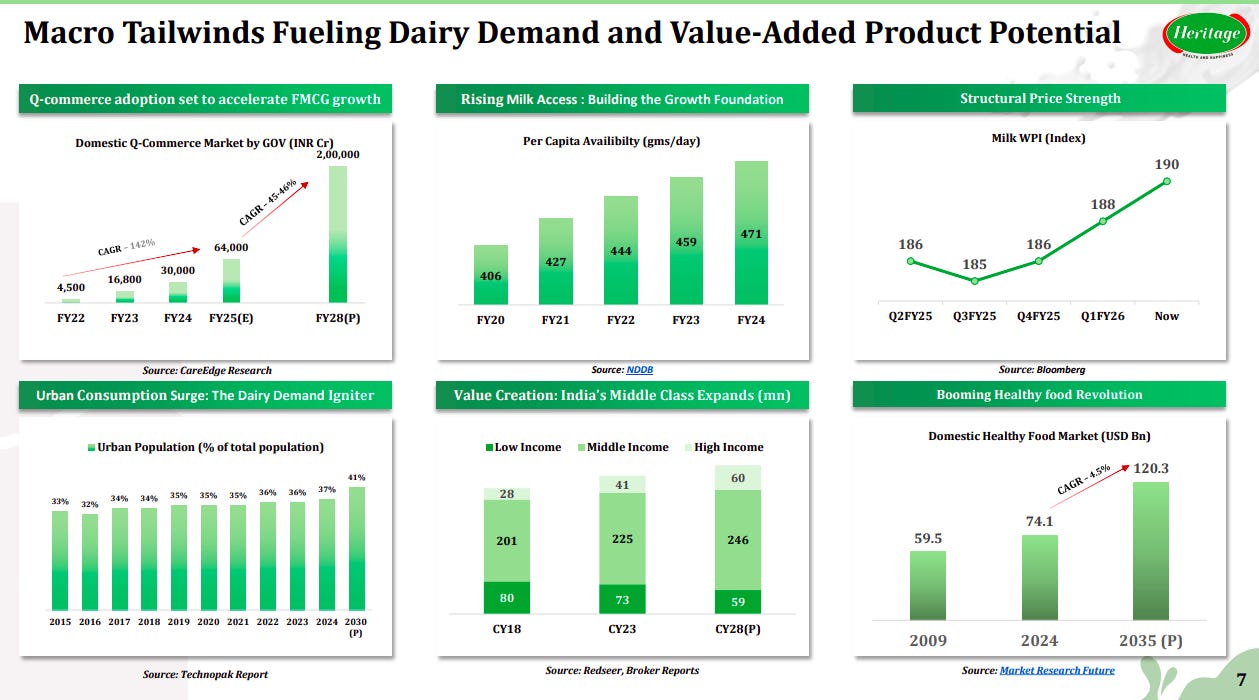
India’s dairy demand is supported by surging Q-commerce (CAGR ~35–40%), higher per capita milk availability (471 g/day in FY24), and urbanization reaching 41% by 2030. The expanding middle class and booming healthy food market (USD 120 bn by 2035) are creating strong long-term growth opportunities for value-added dairy products.
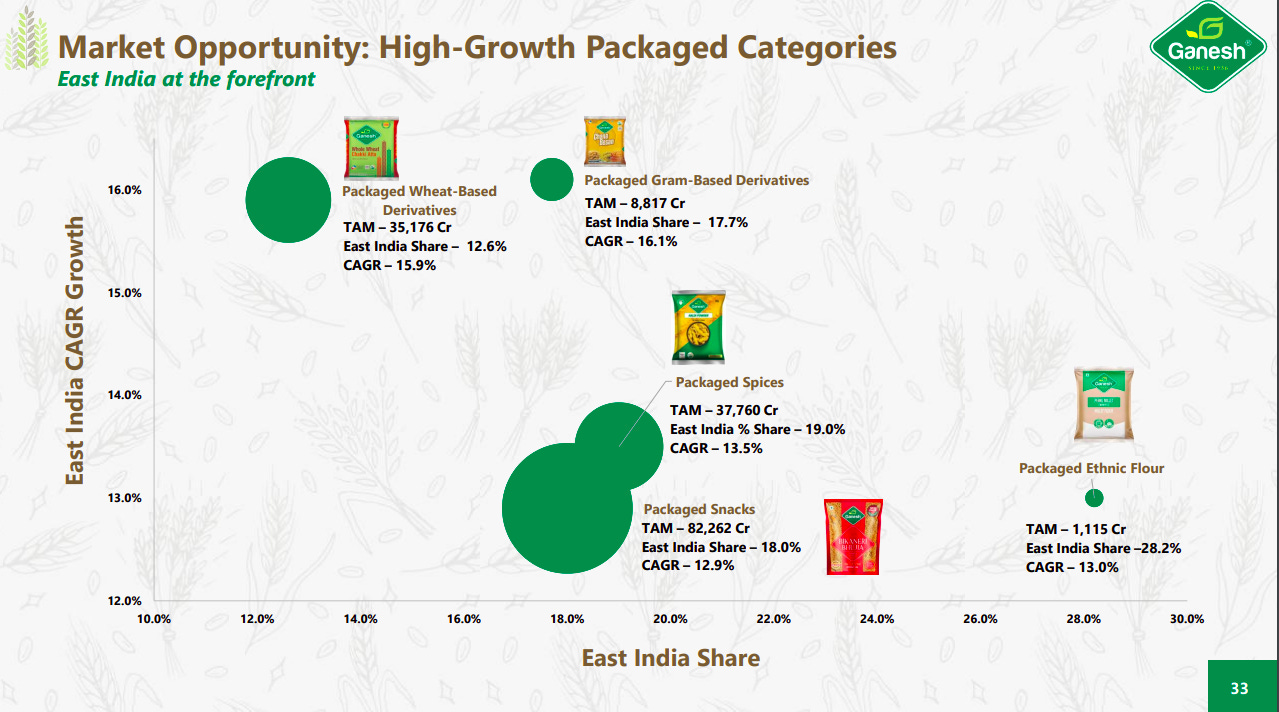
Ganesh Consumer Products | Micro Cap | FMCG
East India is emerging as a key growth driver for packaged food categories, with gram-based derivatives (CAGR 16.1%), wheat-based derivatives (15.9%), and spices (13.5%) leading expansion. Packaged snacks hold the largest market size at ₹82,262 crore, while ethnic flours show the highest East India share (28.2%), highlighting strong regional consumption trends.
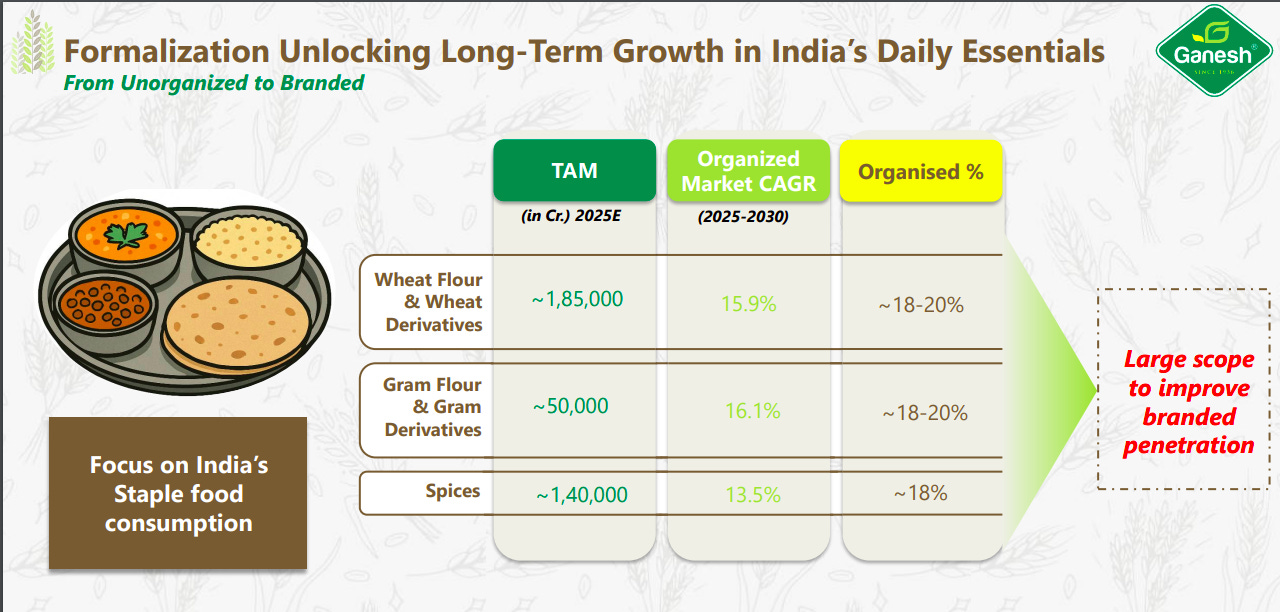
India’s staple food market—comprising wheat, gram, and spices—is witnessing steady formalization. By FY25, the combined TAM exceeds ₹3.75 lakh crore, with the organized segment expected to grow at 13–16% CAGR (2025–2030). With only 18–20% branded penetration, there remains significant headroom for organized players to capture long-term growth in essential food categories.
Chemicals
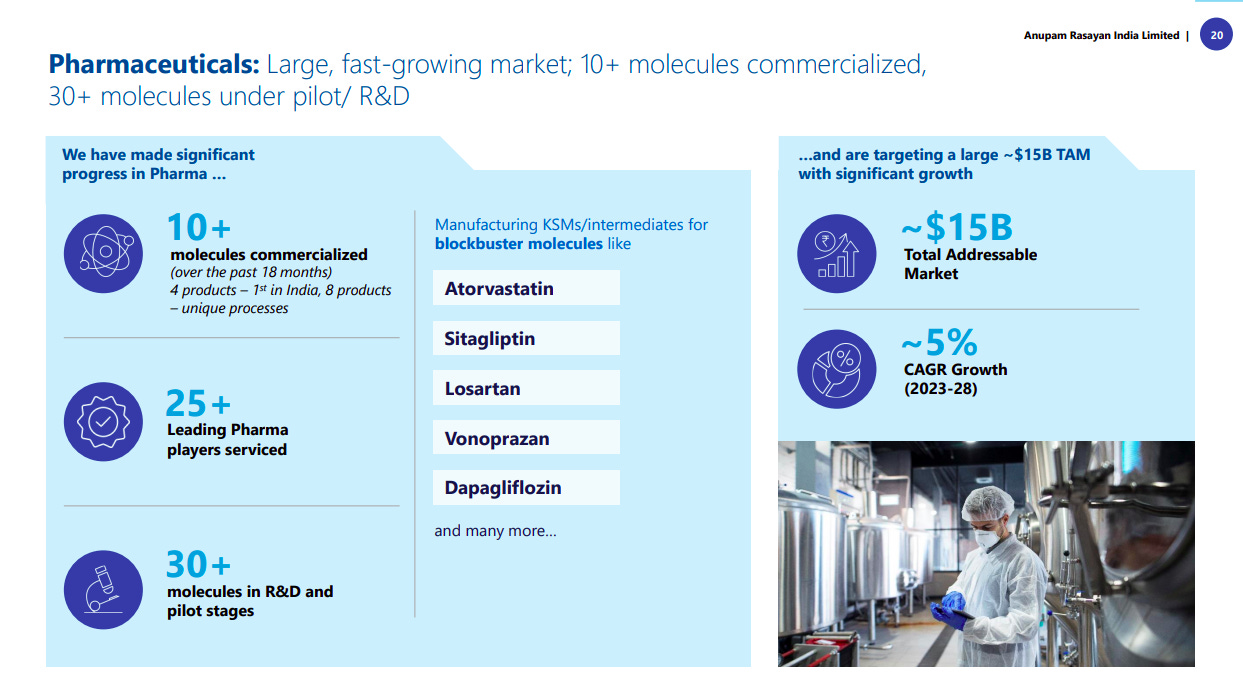
Anupam Rasayan | Small Cap | Chemicals
Anupam Rasayan has expanded its footprint in the pharmaceutical segment, commercializing 10+ molecules in the past 18 months, including 4 first-in-India products. It now services 25+ global pharma leaders and has 30+ molecules under R&D and pilot stages. The company manufactures key intermediates for blockbuster drugs like Atorvastatin, Sitagliptin, Losartan, Vonoprazan, and Dapagliflozin. With a $15 billion total addressable market growing at ~5% CAGR (2023–28), the segment offers strong medium-term growth potential.
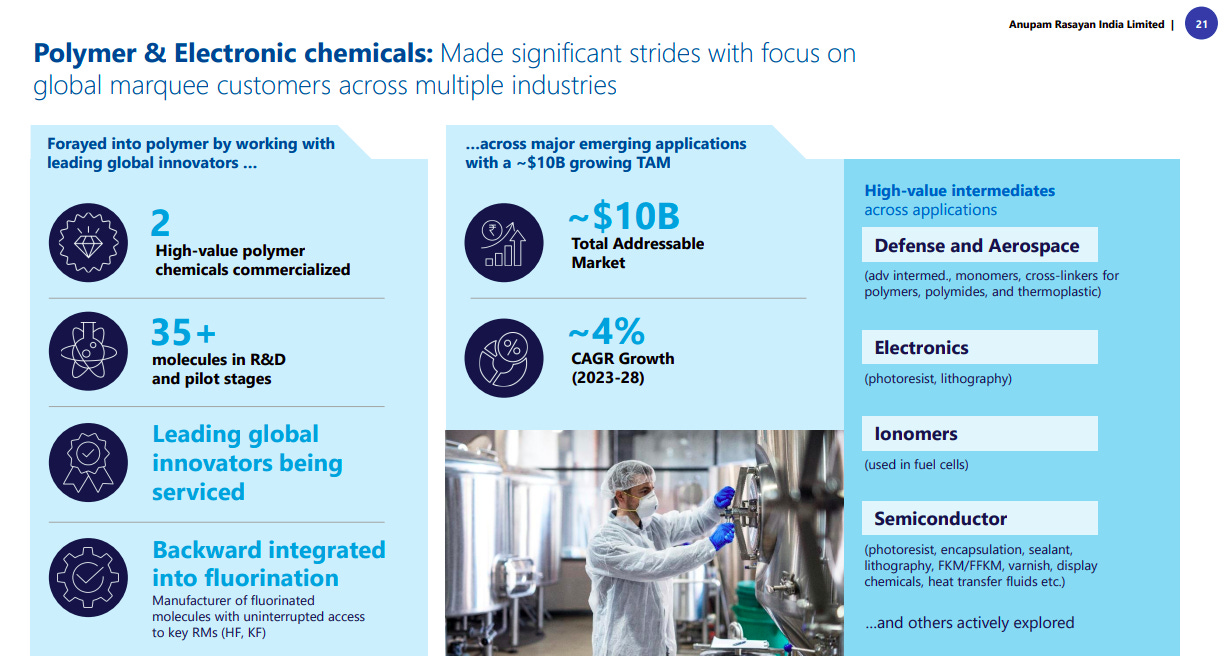
The company has forayed into polymer and electronic chemicals with 2 high-value polymers commercialized and 35+ molecules in R&D. The segment targets a $10 billion global TAM growing at ~4% CAGR, catering to industries like defense, aerospace, semiconductors, and electronics. With backward integration into fluorination and partnerships with leading global innovators, Anupam is building a strong foundation in high-value, technology-intensive applications such as photoresists, ionomers, sealants, and cross-linkers.
Software Services
Aurum Proptech | Micro Cap | Software Services
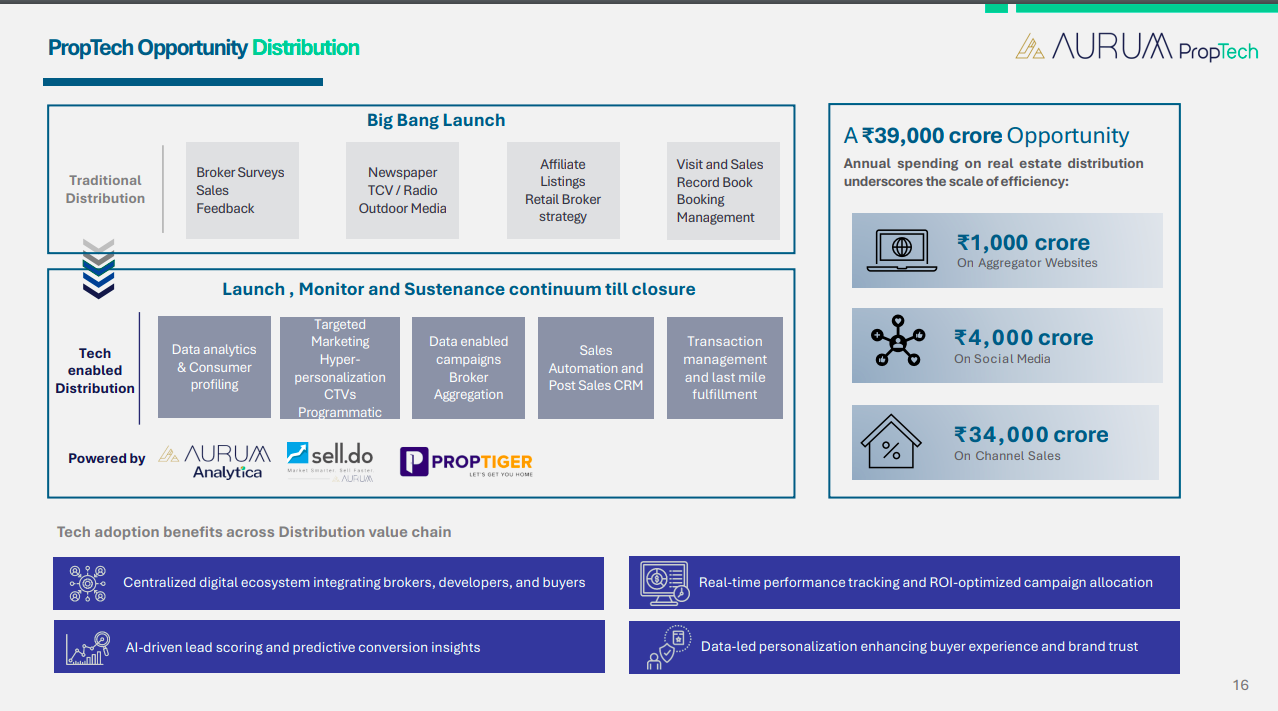
India’s real estate distribution market represents a ₹39,000 crore opportunity, with ₹34,000 crore spent on channel sales and ₹4,000 crore on social media. Aurum PropTech’s data-driven ecosystem integrates analytics, automation, and CRM to transform traditional sales into tech-enabled distribution, enhancing lead conversion, personalization, and ROI optimization across the value chain.
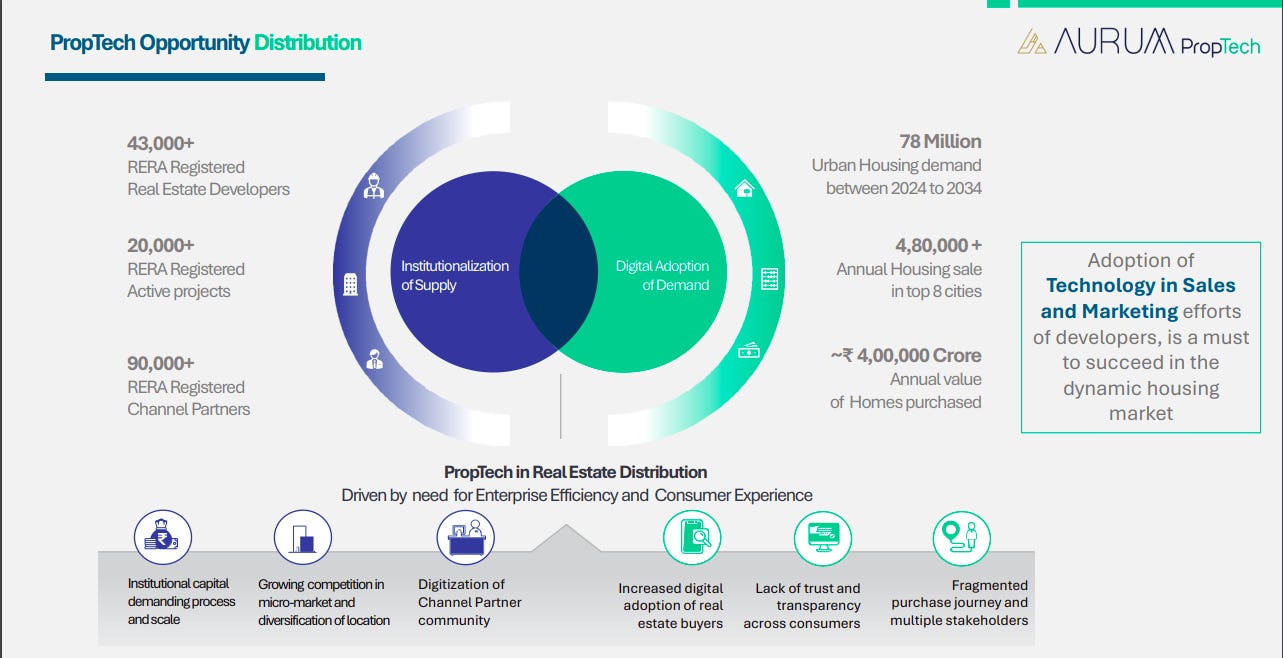
India has over 43,000 RERA-registered developers and 90,000 channel partners, with urban housing demand projected at 78 million units by 2034. The sector, valued at nearly ₹4 lakh crore annually, is being reshaped by digital adoption in sales and marketing, enabling greater enterprise efficiency, transparency, and consumer trust.
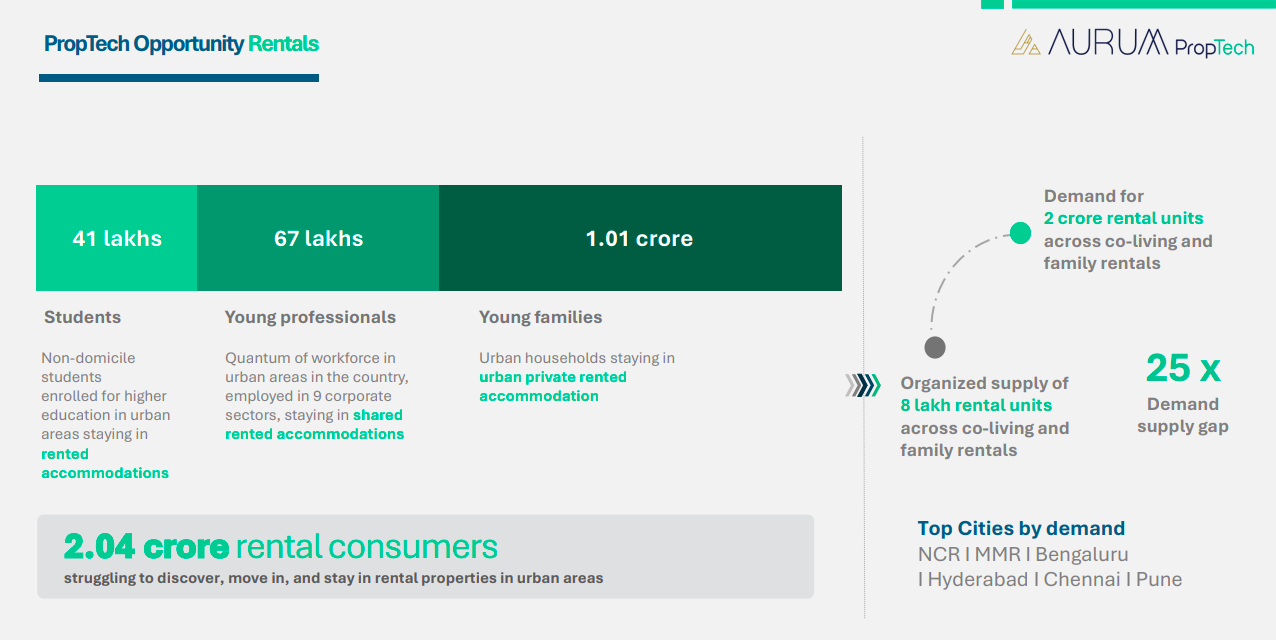
India’s rental housing market comprises 2.04 crore urban consumers, including students, professionals, and families, but faces a 25x demand-supply gap—with only 8 lakh organized rental units available against a demand for 2 crore units. Key high-demand cities include NCR, MMR, Bengaluru, Hyderabad, Chennai, and Pune.
Building Materials
UltraTech Cement | Large Cap | Building Materials
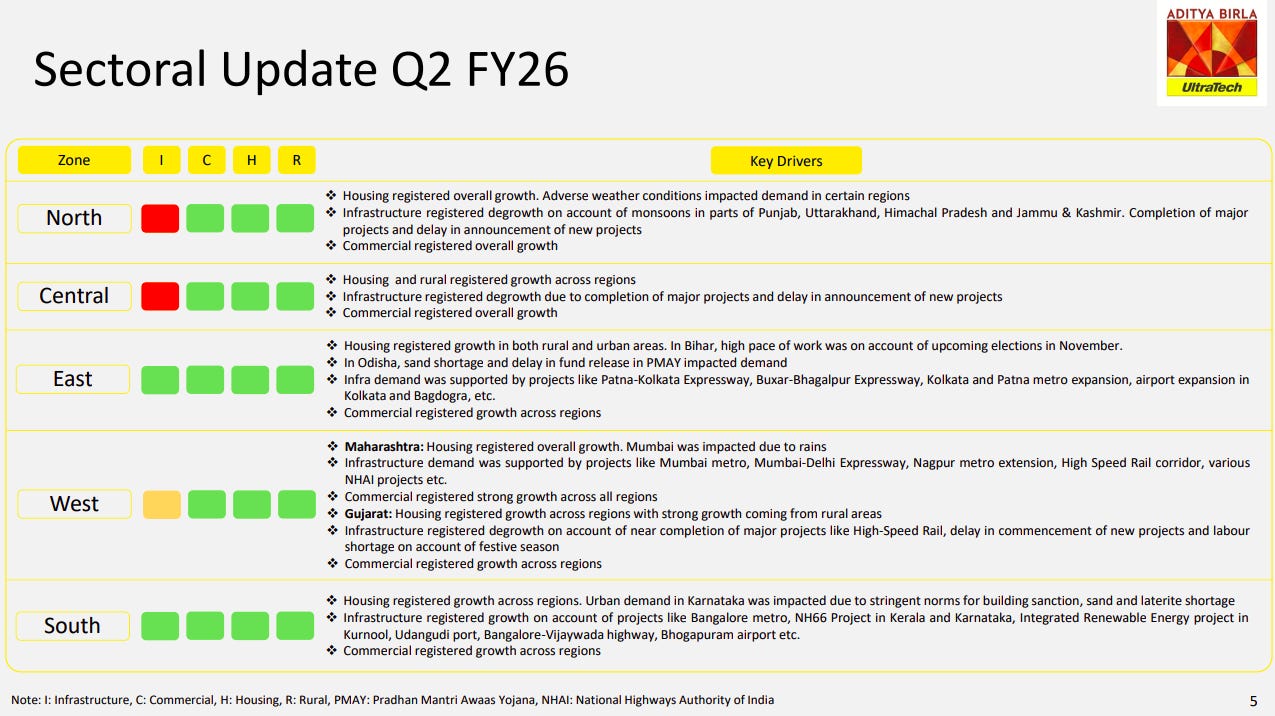
In Q2 FY26, housing and commercial segments showed broad-based growth across all zones, while infrastructure saw mixed trends due to project completions and weather disruptions. The North and Central regions faced infra slowdown from monsoons and project delays, whereas the East and South benefitted from ongoing expressway, metro, and airport works. The West zone, particularly Maharashtra and Gujarat, recorded strong housing momentum supported by metro and high-speed rail projects despite rainfall-related challenges. Overall, rural demand and government housing initiatives (PMAY) continued to underpin sectoral resilience.
India Cements | Small Cap | Building Materials
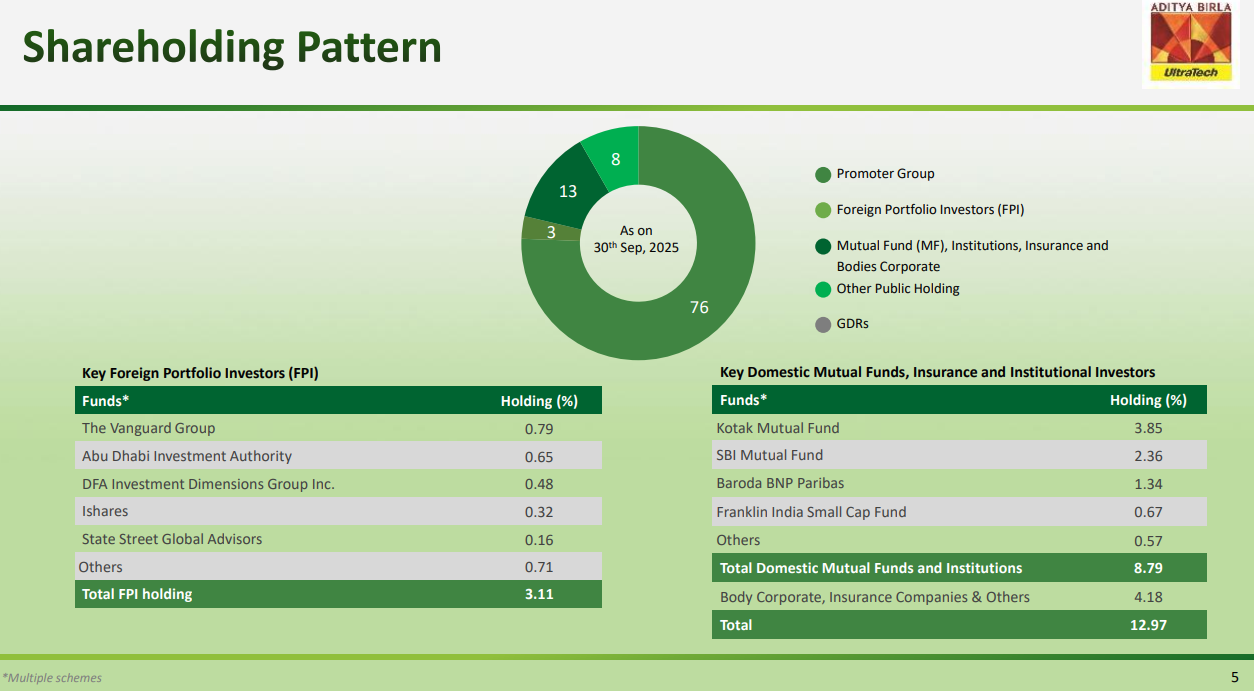
The India Cements’ ownership is heavily concentrated with the promoter group holding 76% as of September 2025. Foreign portfolio investors account for 3%, while mutual funds, institutions, insurance companies and corporates collectively hold 13%, with another 8% in other public holdings. Among key institutional investors, Kotak Mutual Fund leads domestic holdings at 3.85%, while The Vanguard Group tops foreign investors with 0.79%.
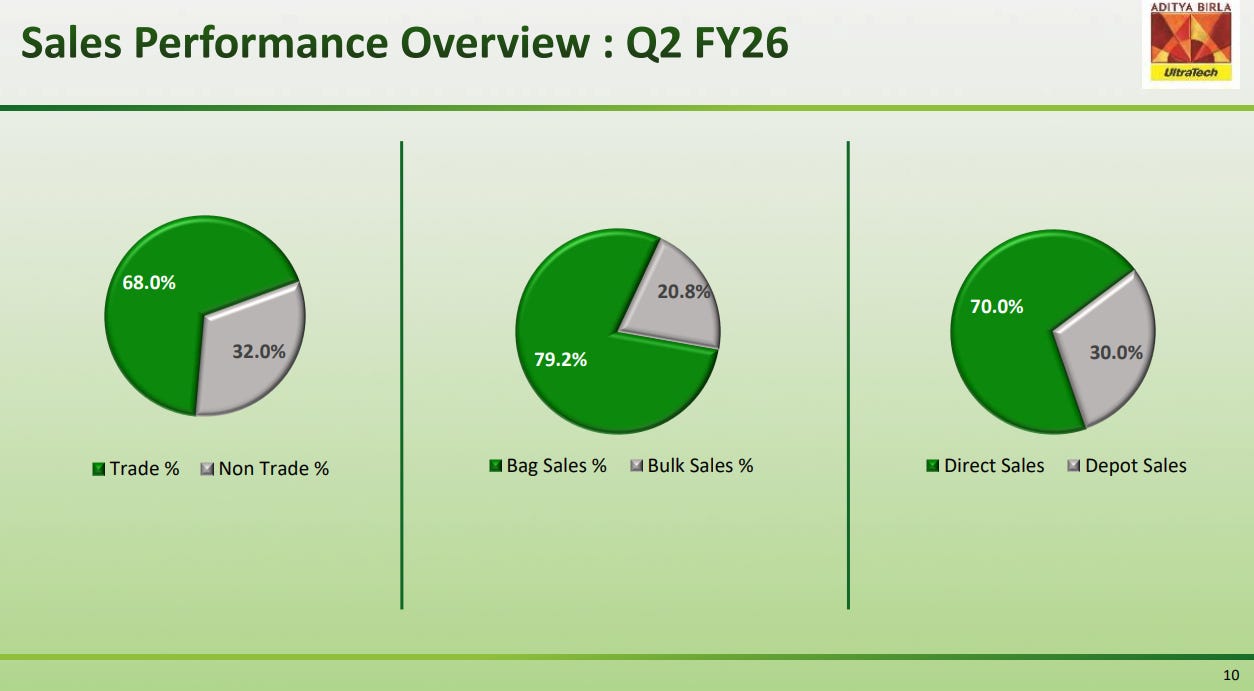
The company’s cement business in Q2 FY26 shows a clear tilt toward the trade segment and packaged cement. Trade sales made up 68% of volumes versus 32% for non-trade business. Bagged cement dominated with 79.2% share while bulk sales accounted for 20.8%. From a distribution standpoint, direct sales comprised 70% of volumes, with the remaining 30% moving through the depot network.
Media & Entertainment
PVR INOX Limited | Small Cap | Media & Entertainment
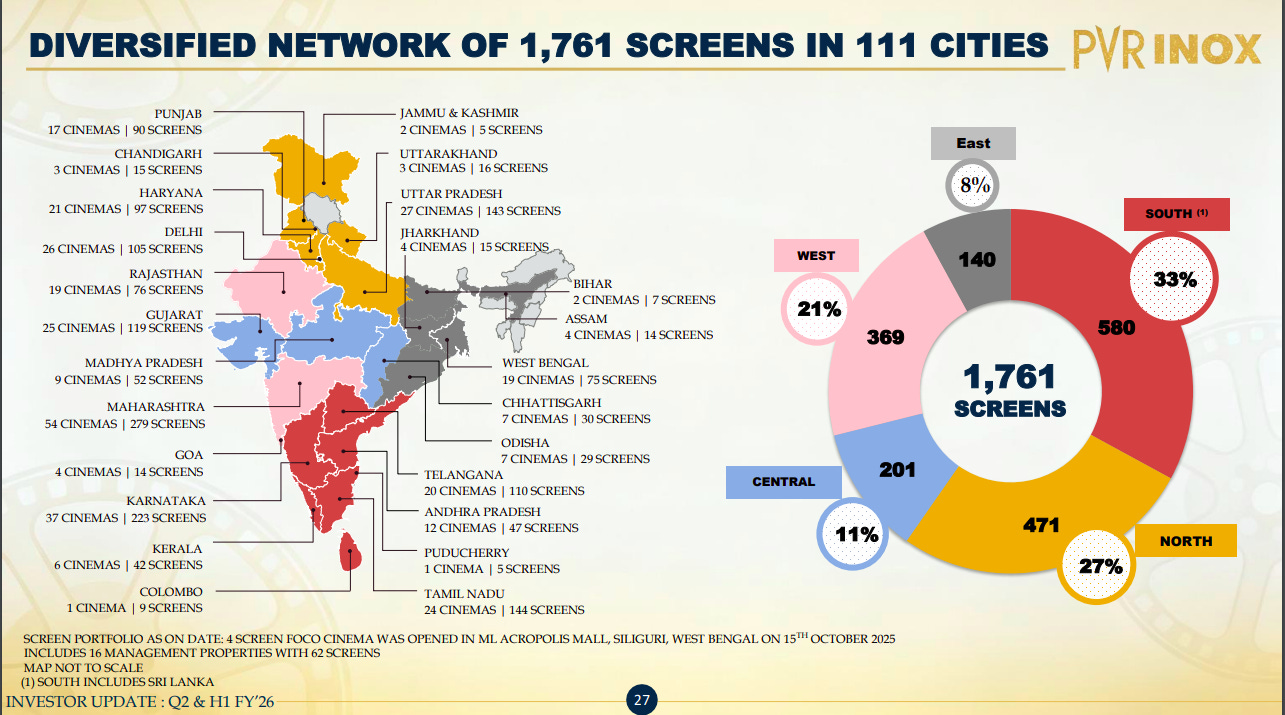
PVR INOX operates a network of 1,761 screens across 111 cities, with the South region leading at 580 screens (33%), followed by the North (27%), West (21%), Central (11%), and East (8%). Maharashtra, Karnataka, Tamil Nadu, and Uttar Pradesh remain key markets, reflecting a well-distributed national presence.
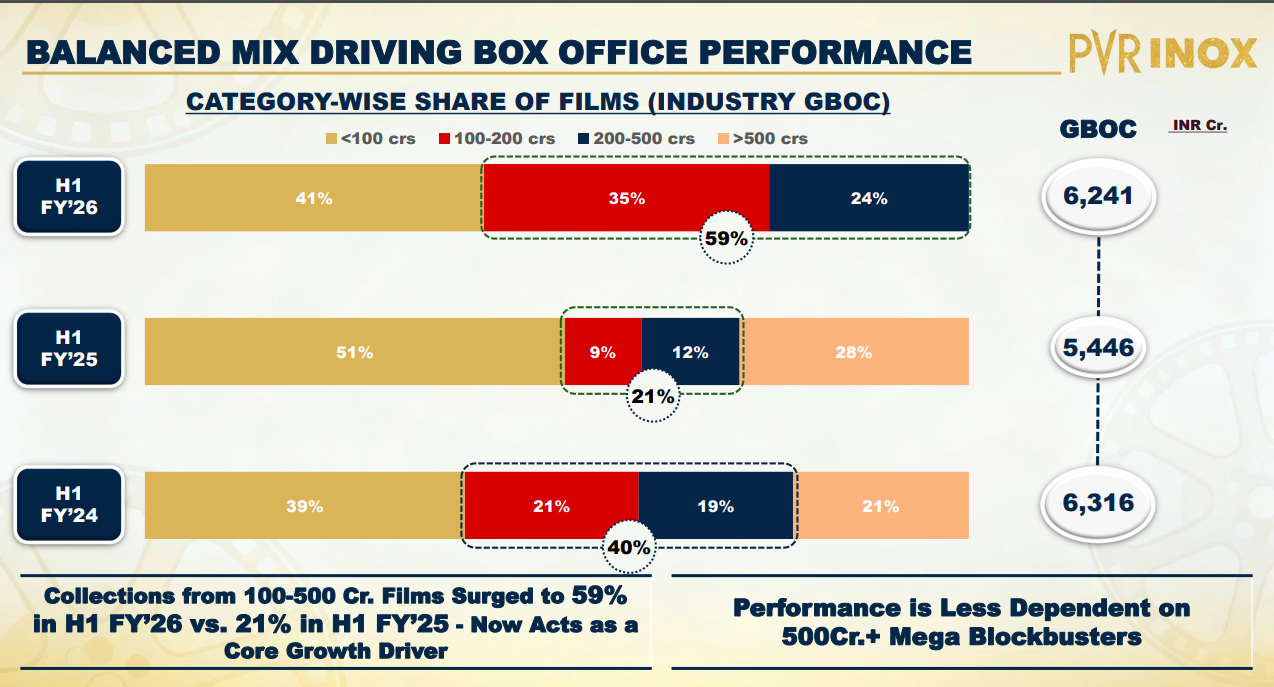
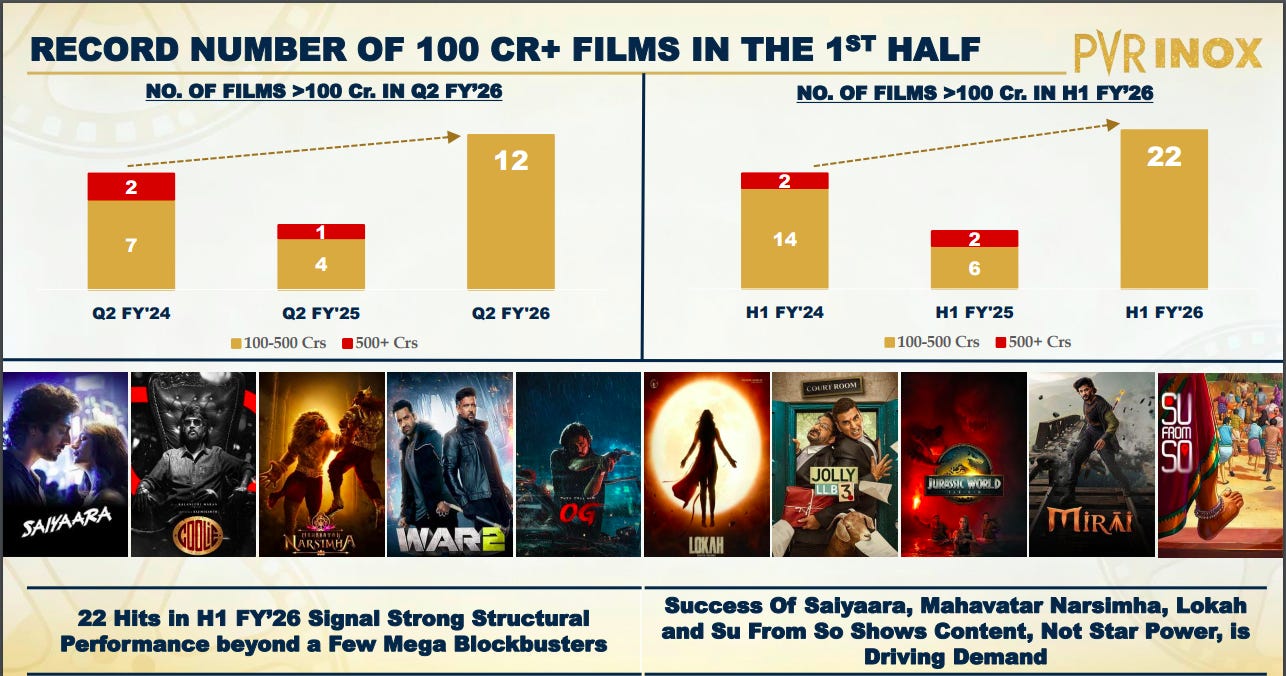
In H1 FY26, films earning ₹100–500 crore contributed 59% of total box office collections, up sharply from 21% in H1 FY25, driving growth to ₹6,241 crore GBOC. This shift indicates the industry’s reduced dependence on ₹500 crore+ mega blockbusters, with mid-range hits emerging as strong revenue drivers.
PVR INOX witnessed a record 22 films crossing ₹100 crore in H1 FY26, up from 8 last year, highlighting broad-based content success. Movies like Saiyaara, Mahavatar Narsimha, Lokah, and Su From So underscore how content-driven performance—not just star power—is fueling audience demand and box office momentum.
Metals
Hindustan Zinc | Large Cap | Metals
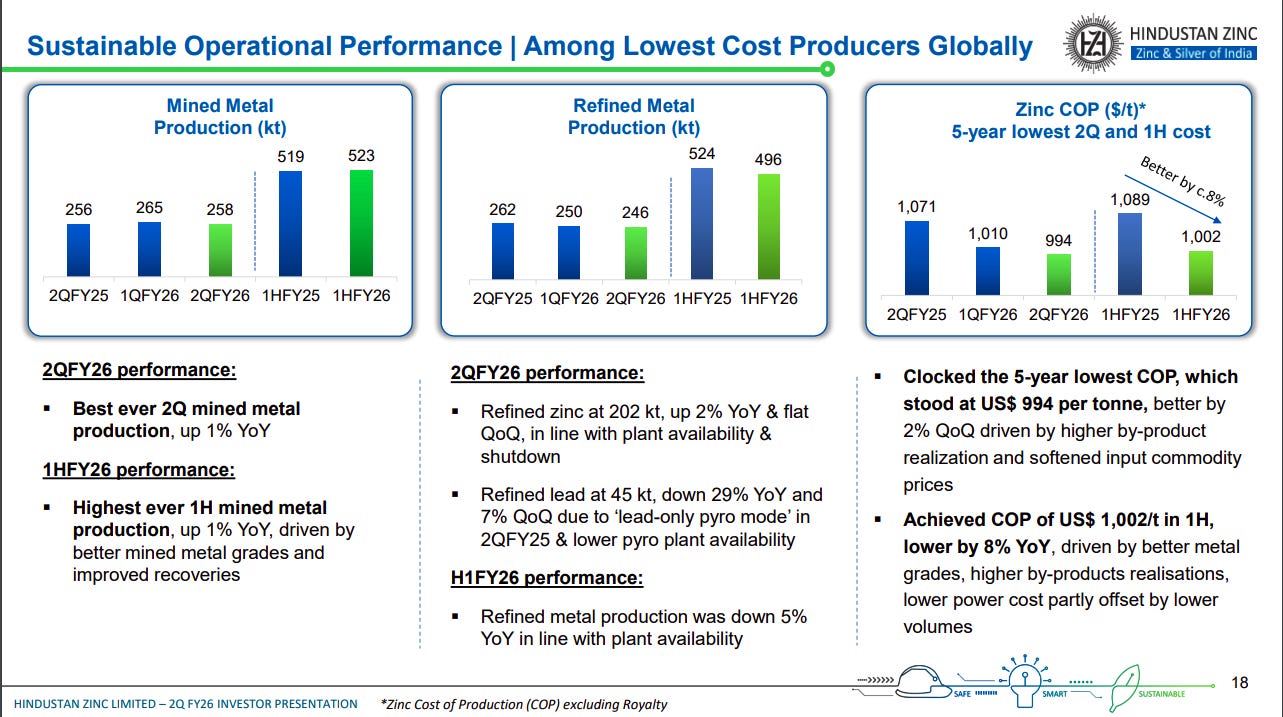
Hindustan Zinc achieved its best-ever Q2 mined metal production at 258 kt, up 1% YoY, and 5-year lowest cost of production (COP) at $994/t, aided by softer input costs and higher by-product realizations. For 1HFY26, mined metal rose to 523 kt, while refined metal dipped 5% YoY due to plant availability, keeping COP lower by 8% YoY at $1,002/t.
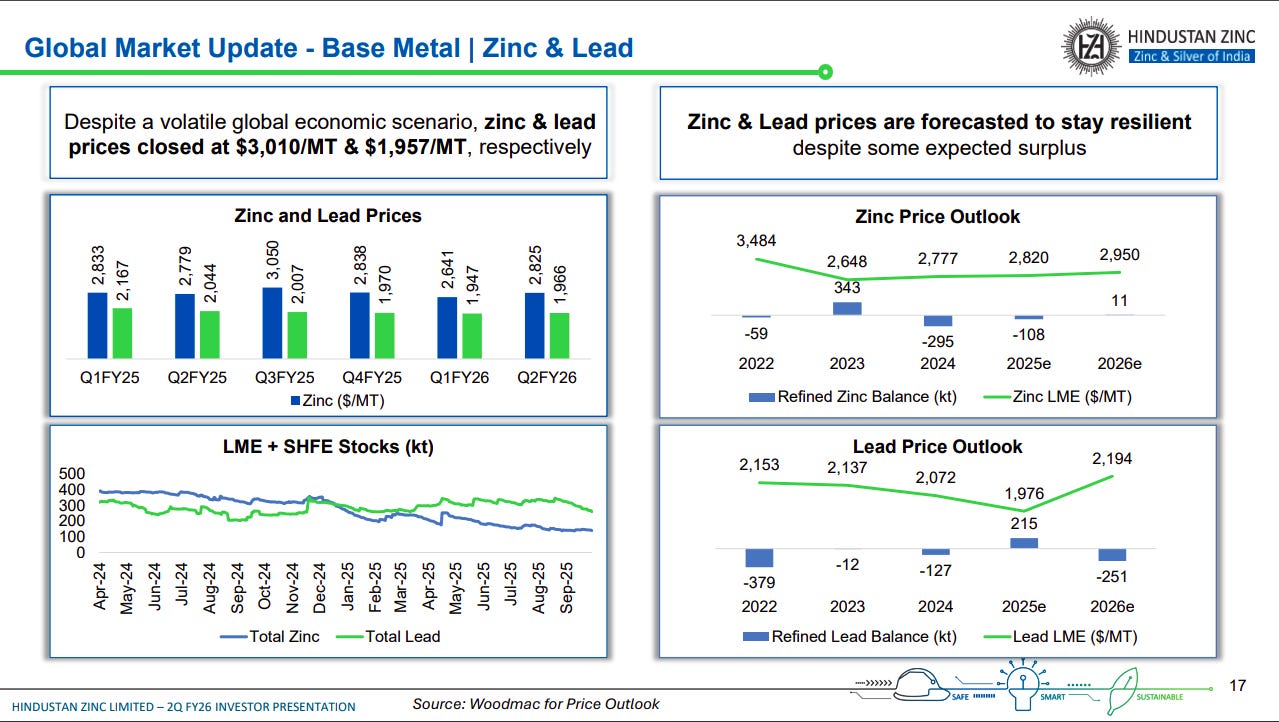
Zinc and lead prices closed at $3,010/MT and $1,957/MT, up sequentially amid tight inventories. Prices are expected to remain resilient despite modest surpluses projected for 2026. LME and SHFE stock levels continued to decline, reflecting steady demand.
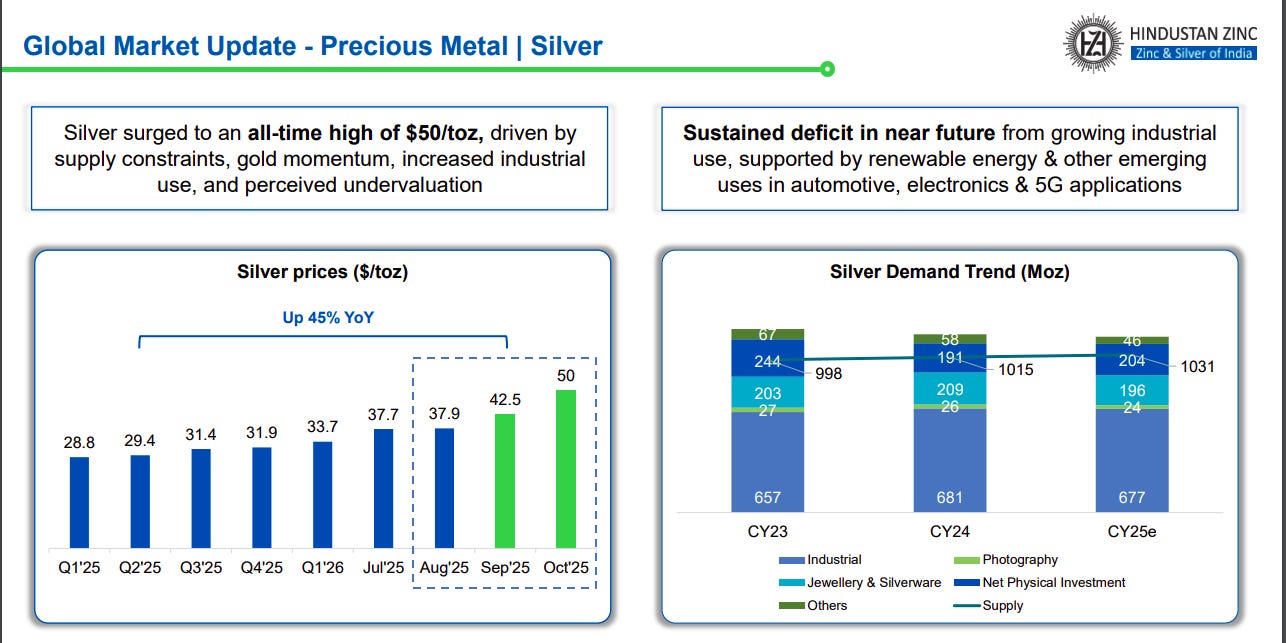
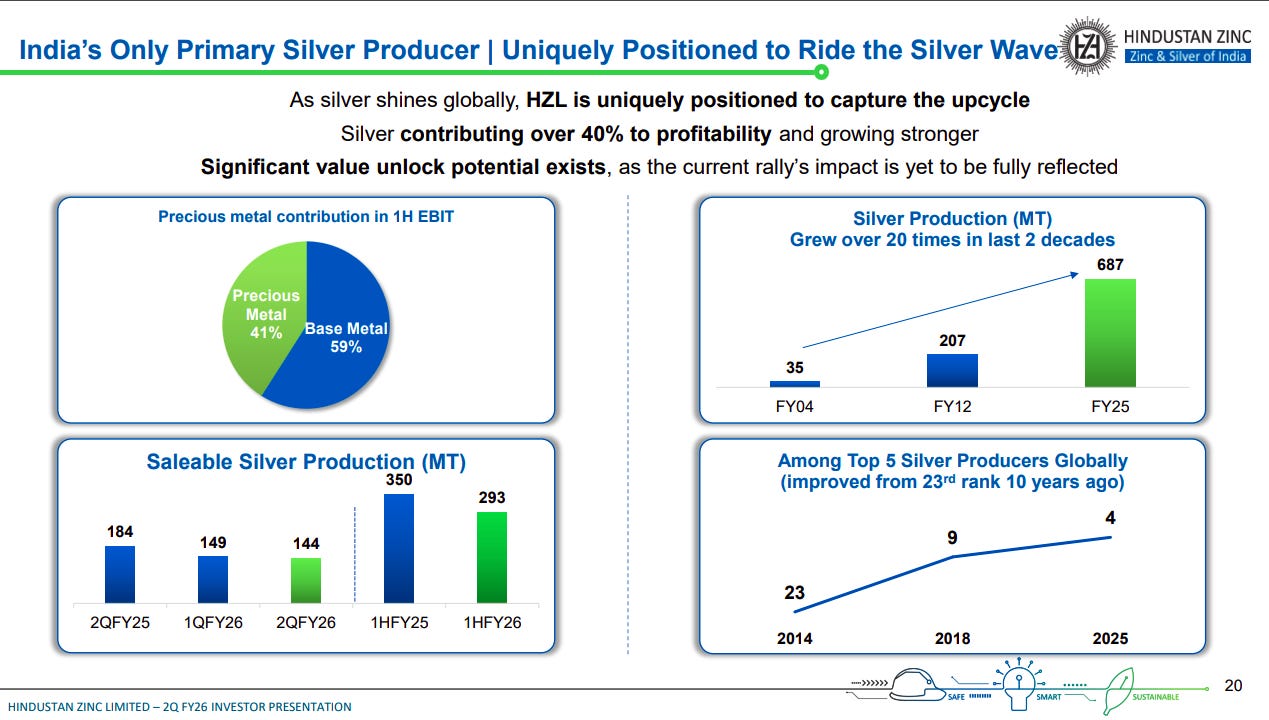
Silver prices surged 45% YoY to an all-time high of $50/oz, driven by supply constraints, industrial demand, and gold momentum. Demand is projected to grow from 998 Moz in CY23 to 1,031 Moz in CY25, led by renewable energy, electronics, and 5G applications, maintaining a structural deficit.
Hindustan Zinc, contributing over 40% of profits from silver, produced 144 MT in Q2FY26 and 293 MT in 1HFY26. Silver output has risen over 20x in two decades, placing the company among the top 5 global producers, with strong value-unlock potential as silver prices rally.
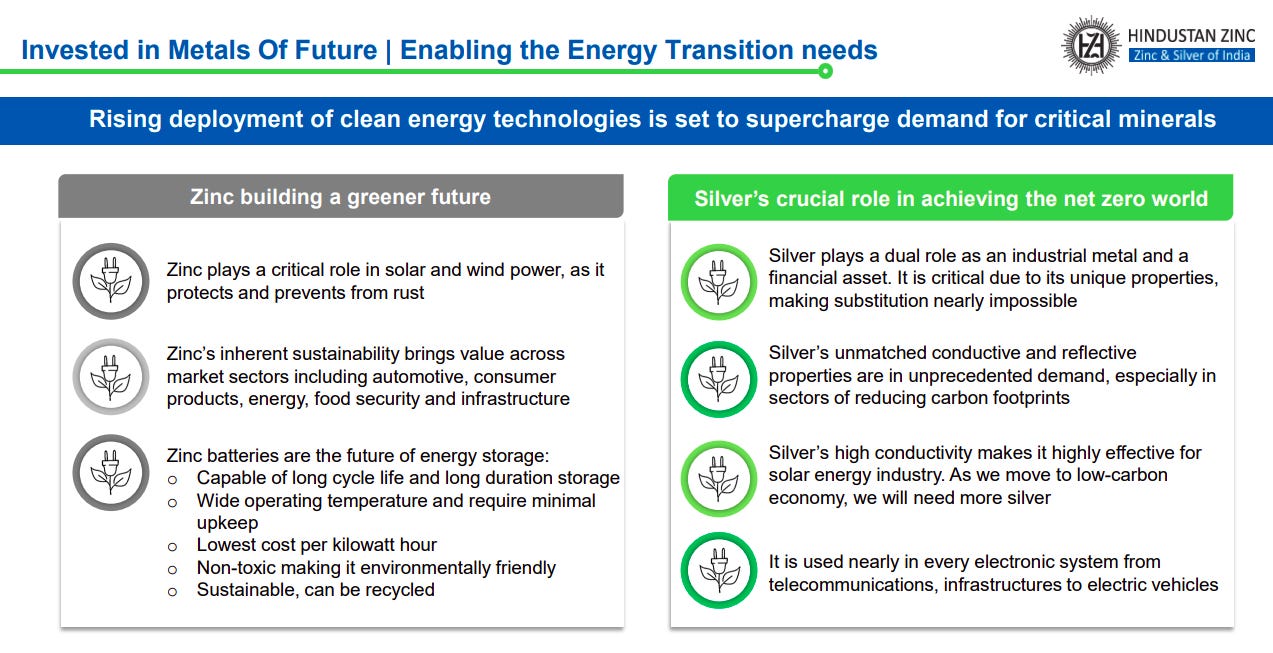
Zinc and silver are pivotal to the clean-energy transition—zinc through corrosion protection and next-gen batteries, and silver through its unmatched conductivity and essential role in solar, EV, and electronics applications.
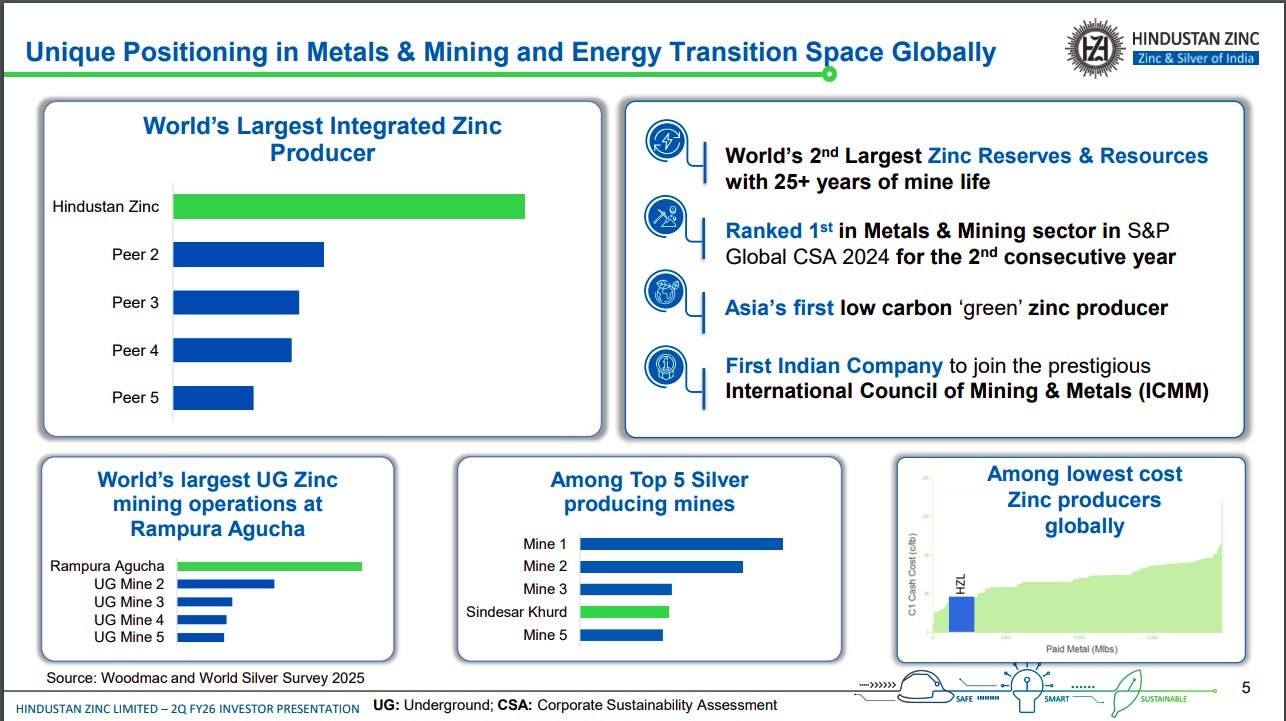
Hindustan Zinc is the world’s largest integrated zinc producer with the 2nd largest global zinc reserves, Asia’s first green zinc producer, and among the lowest-cost producers globally. It also ranks top 5 in silver output, backed by large underground mining operations at Rampura Agucha.
JSW Steel | Large Cap | Metals
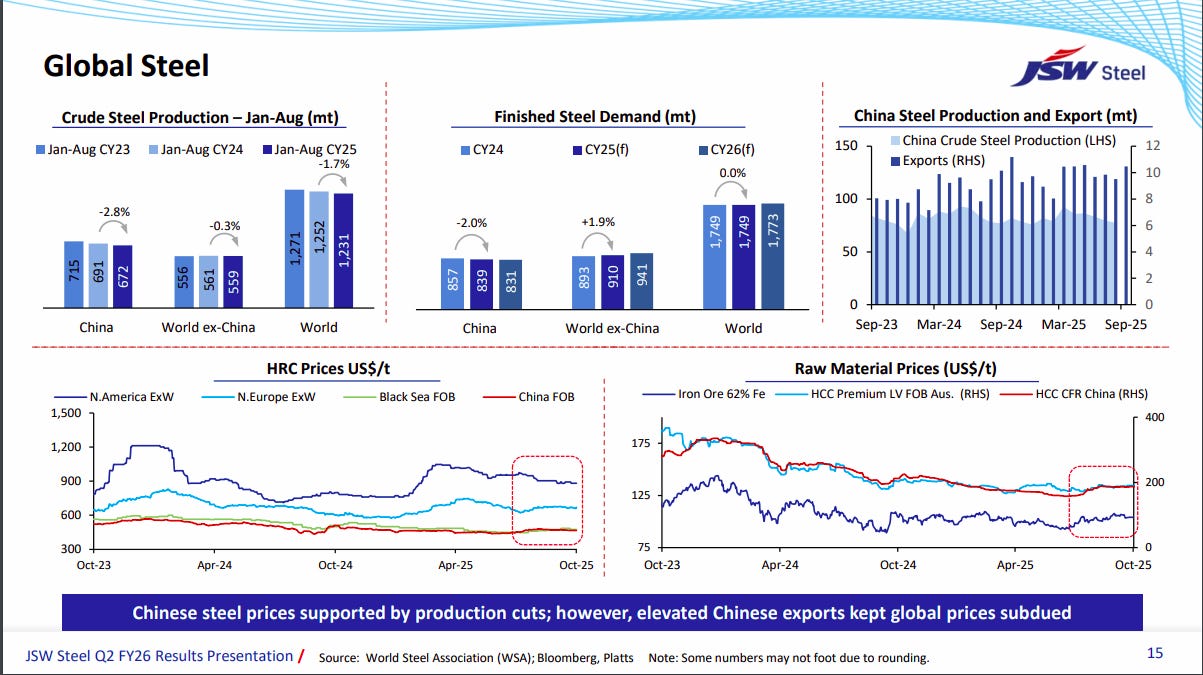
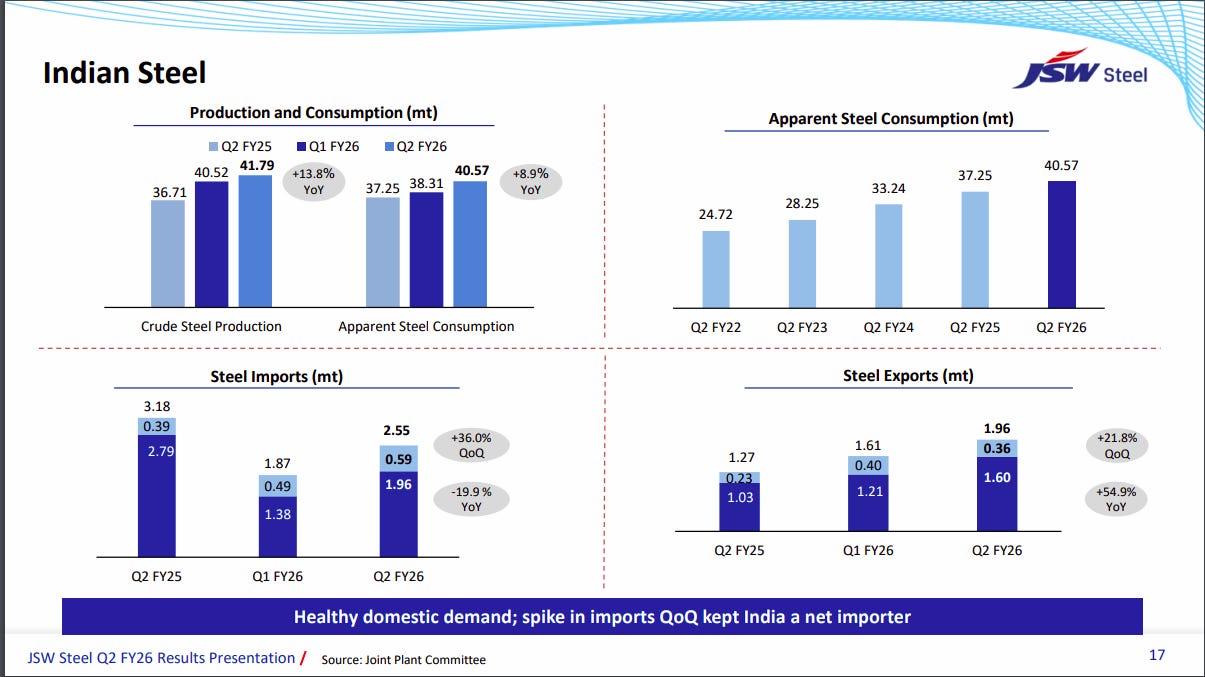
Global crude steel production fell 1.7% YoY in Jan–Aug CY25, with China down 2.8%, while demand outside China rose 1.9%. Chinese steel prices stayed supported by production cuts, but high export volumes capped global prices. Raw material prices, including iron ore and coking coal, remained volatile yet stable at lower levels compared to last year.
India’s steel sector saw strong growth in Q2 FY26, with crude steel production up 13.8% YoY to 41.79 mt and consumption up 8.9% YoY to 40.57 mt, reflecting healthy domestic demand. Imports surged 36% QoQ, keeping India a net importer, while exports rose 55% YoY to 1.96 mt, supported by robust overseas demand.
EPack Prefab Technologies Ltd. | Small Cap | Metals
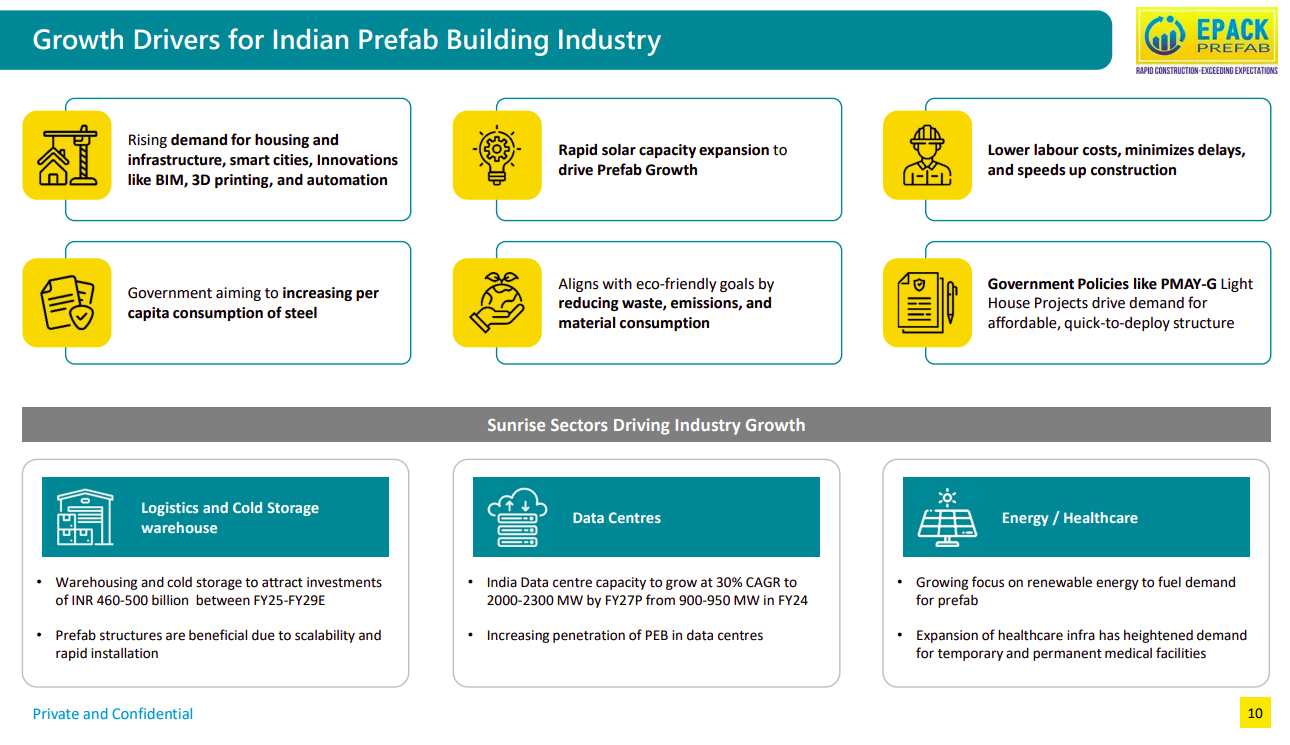
India’s prefab building industry is being fueled by a mix of structural demand and policy tailwinds. Rising housing and infrastructure needs, rapid solar capacity expansion, and lower labor costs are driving adoption of prefab solutions. Government initiatives like increasing steel consumption per capita and schemes like PMAY-G are creating demand for affordable, quick-to-deploy structures, while eco-friendly goals are pushing the shift toward reduced waste and emissions. Three sunrise sectors stand out: logistics and cold storage, expected to attract ₹460-500 billion in investments by FY29E; data centers, with capacity set to grow at 30% CAGR to 2,000-2,300 MW by FY27P; and energy and healthcare, where renewable energy expansion and healthcare infrastructure growth are boosting demand for prefab structures.
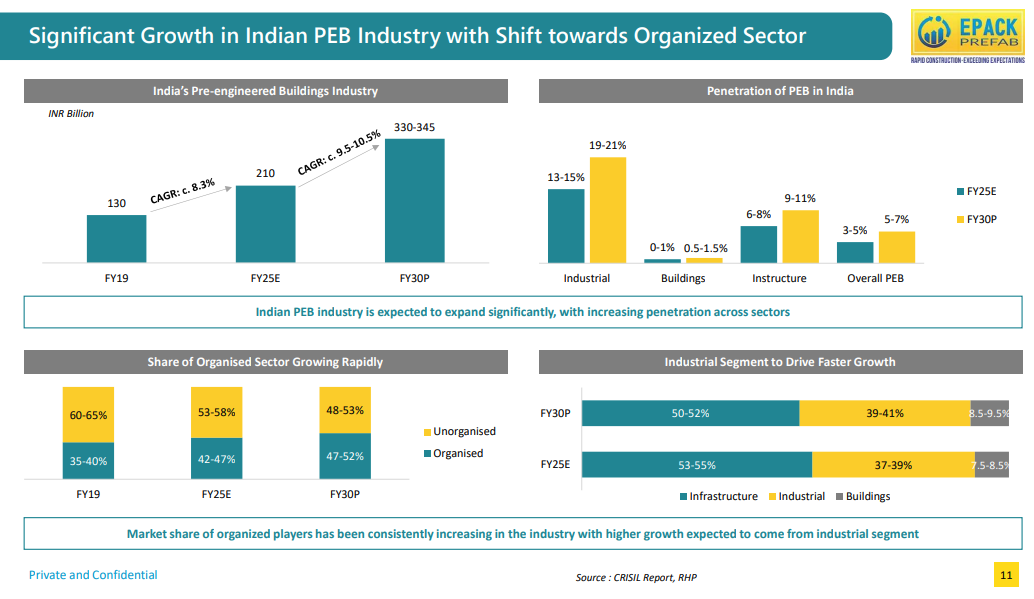
India’s pre-engineered building industry is growing rapidly, expected to jump from ₹210 billion in FY25 to around ₹340 billion by FY30. The organized sector is steadily gaining ground—its share is projected to rise from 42-47% to nearly half the market by FY30. Industrial buildings are leading this expansion, with their market share expected to grow from 53-55% to 50-52%, while the sector’s penetration in industrial applications could reach 19-21% by FY30, up from just 13-15% today.
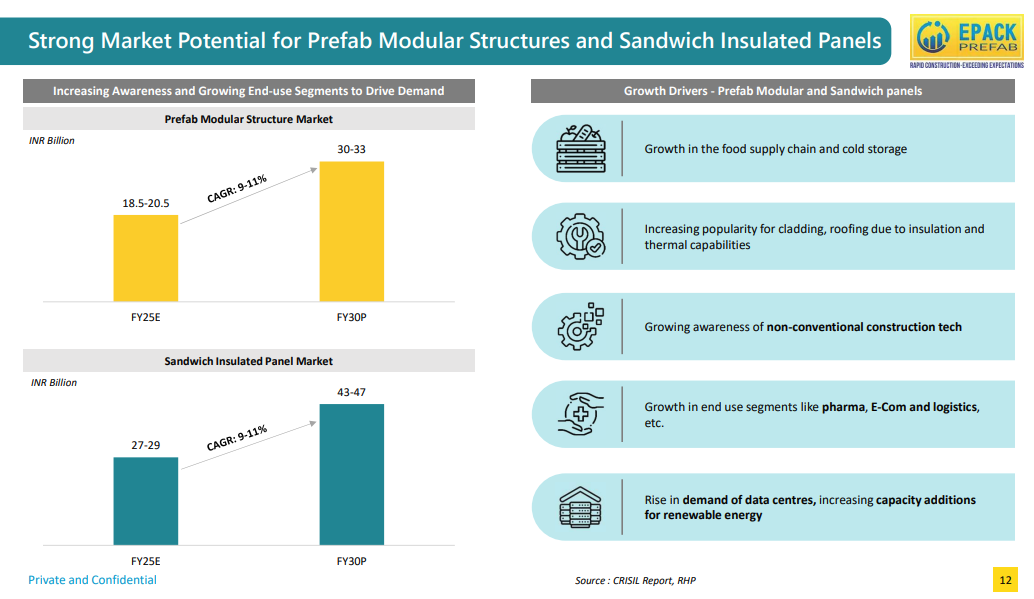
Both prefab modular structures and sandwich insulated panels are poised for strong growth, with markets expected to expand at about 9-11% annually through FY30. Prefab modular structures could nearly double from ₹19-21 billion to ₹30-33 billion, while sandwich panels may grow from ₹27-29 billion to ₹43-47 billion. This growth is being driven by expansion in cold storage and food supply chains, increasing use of insulated panels for roofing and cladding, rising awareness of modern construction methods, and growing demand from pharma, e-commerce, logistics, and data center sectors.
Financial Services
IDFC First Bank | Mid Cap | Financial Services
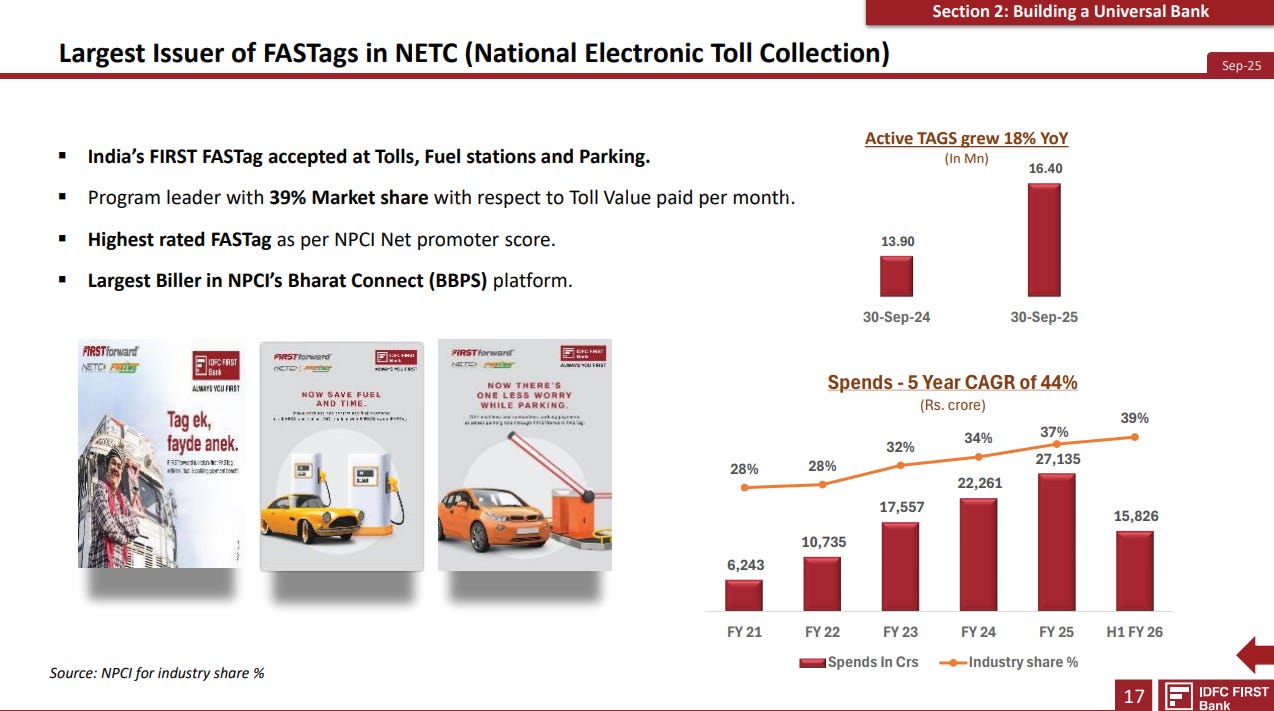
IDFC First Bank is the biggest player in India’s FASTag ecosystem. They were the first to make FASTags work across tolls, fuel stations, and parking—basically building a universal payment tag. They’ve captured 39% of the toll value market and have the highest NPCI rating among all FASTag providers. The business is growing fast, with active tags up 18% year-on-year and spending through their tags growing at a 44% CAGR over five years, now at ₹27,135 crore in FY25.
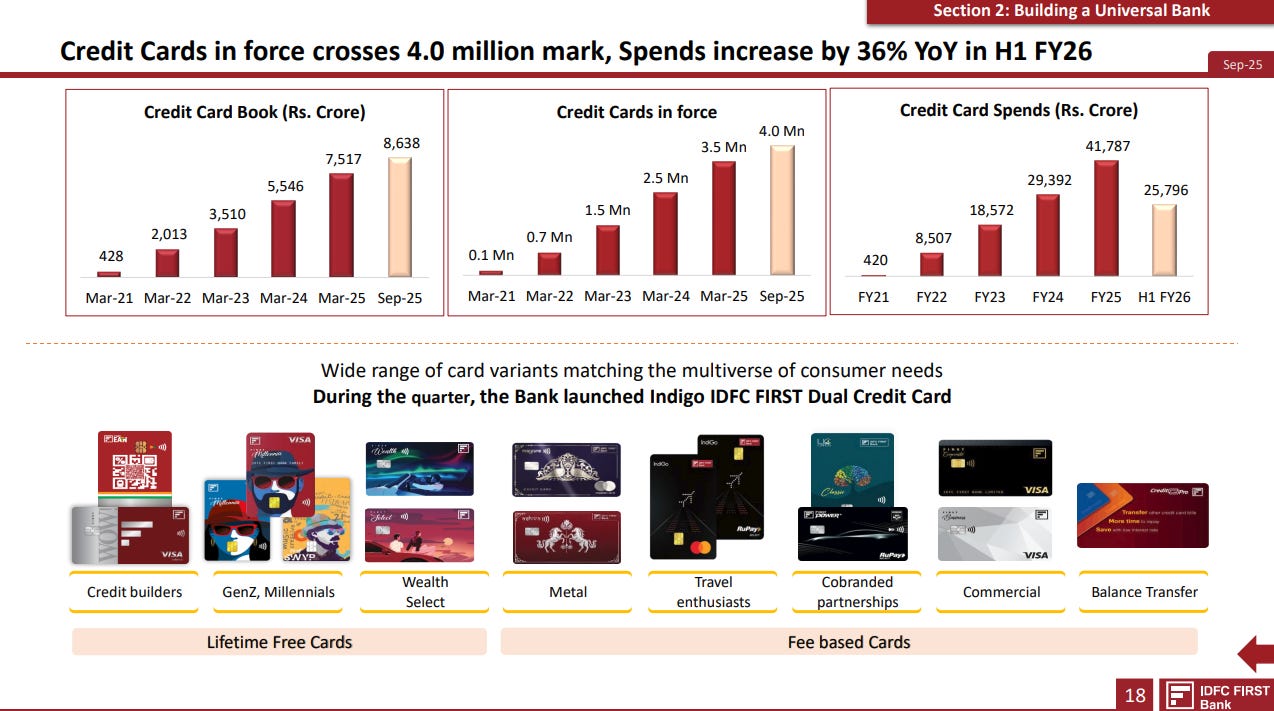
IDFC FIRST Bank’s credit card business hit a milestone with over 4 million cards in circulation as of September 2025, up from just 0.1 million in March 2021. The credit card book has grown exponentially to ₹8,638 crore, while spends surged 36% year-on-year in the first half of FY26, reaching ₹25,796 crore. The bank caters to diverse customer segments with specialized cards—from credit builders and GenZ-focused options to premium metal cards, travel cards, and cobranded partnerships like the newly launched Indigo dual credit card. These offerings are split between lifetime free cards and fee-based premium variants.
Federal Bank | Mid Cap | Financial Services
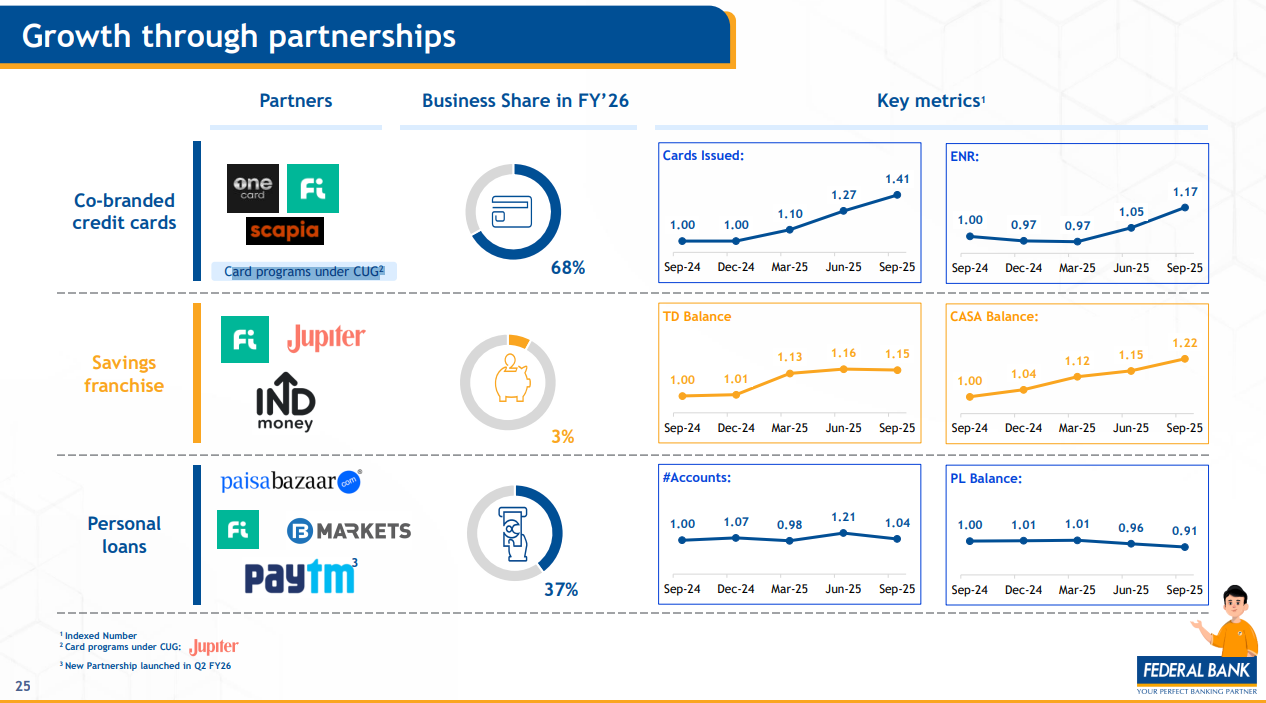
Federal Bank is scaling its business through strategic fintech partnerships across three key areas. For co-branded credit cards, partners like OneCard, Fi, and Scapia now contribute 68% of the bank’s card issuances, with cards issued growing 41% year-on-year. On the savings side, partnerships with Fi, Jupiter, and IndMoney account for 3% of the franchise, with CASA balances up 22% and term deposits up 15% since September 2024. In personal loans, tie-ups with Paisabazaar, B Markets, and Paytm drive 37% of the book, though overall balances have dipped 9% from the previous year.
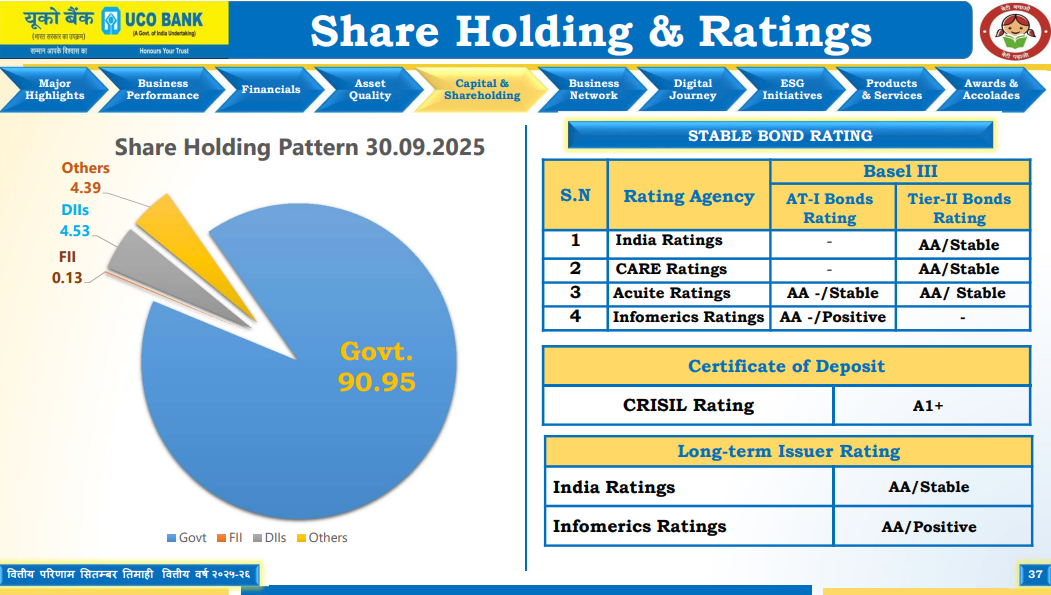
UCO Bank | Mid Cap | Financial Services
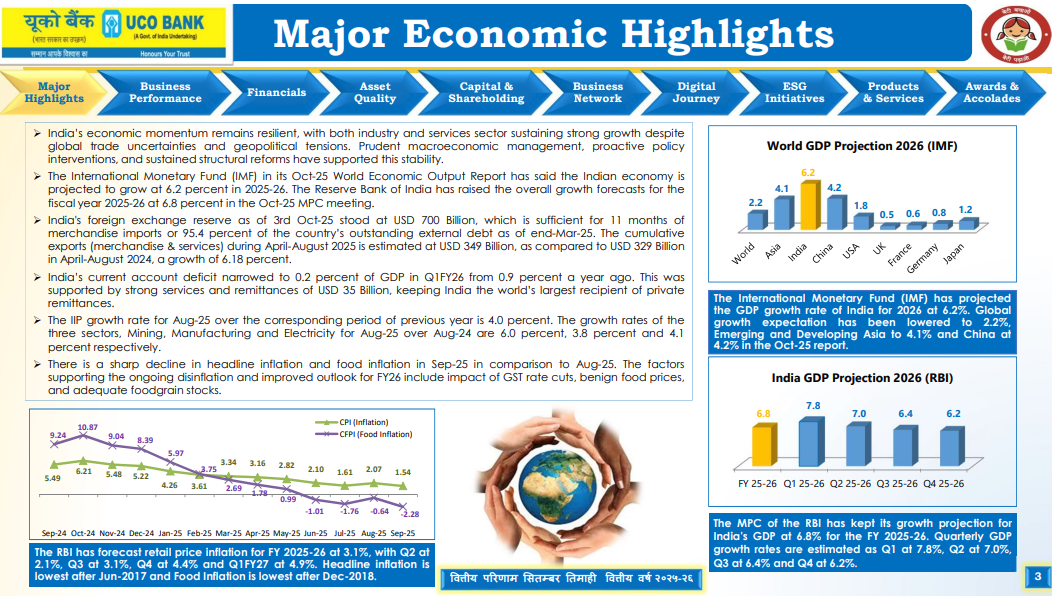
India’s economy is holding steady despite global headwinds. The IMF projects India’s GDP growth at 6.2% for 2026, while the RBI is slightly more optimistic at 6.8% for FY 2025-26. Inflation is cooling off—retail inflation for FY 2025-26 is forecast at 3.1%, with headline inflation at its lowest since mid-2017 and food inflation at its lowest since late 2018. The current account deficit has also improved to 0.2% of GDP, supported by strong services exports and remittances. Meanwhile, forex reserves stood at $700 billion as of early October 2025, providing a comfortable cushion for nearly 11 months of imports.
UCO Bank’s ownership is overwhelmingly in government hands—over 90% as of September 2025. The remaining stake is split between DIIs, FIIs, and other investors, each holding less than 5%. On the ratings front, the bank enjoys solid standing across multiple agencies. Its bonds carry AA/Stable ratings from agencies like India Ratings, CARE, and Acuite, while certificates of deposit are rated A1+ by CRISIL. The bank also holds AA/Stable and AA/Positive ratings for long-term issuances, reflecting stable creditworthiness.
Bank of Maharashtra | Mid Cap | Financial Services
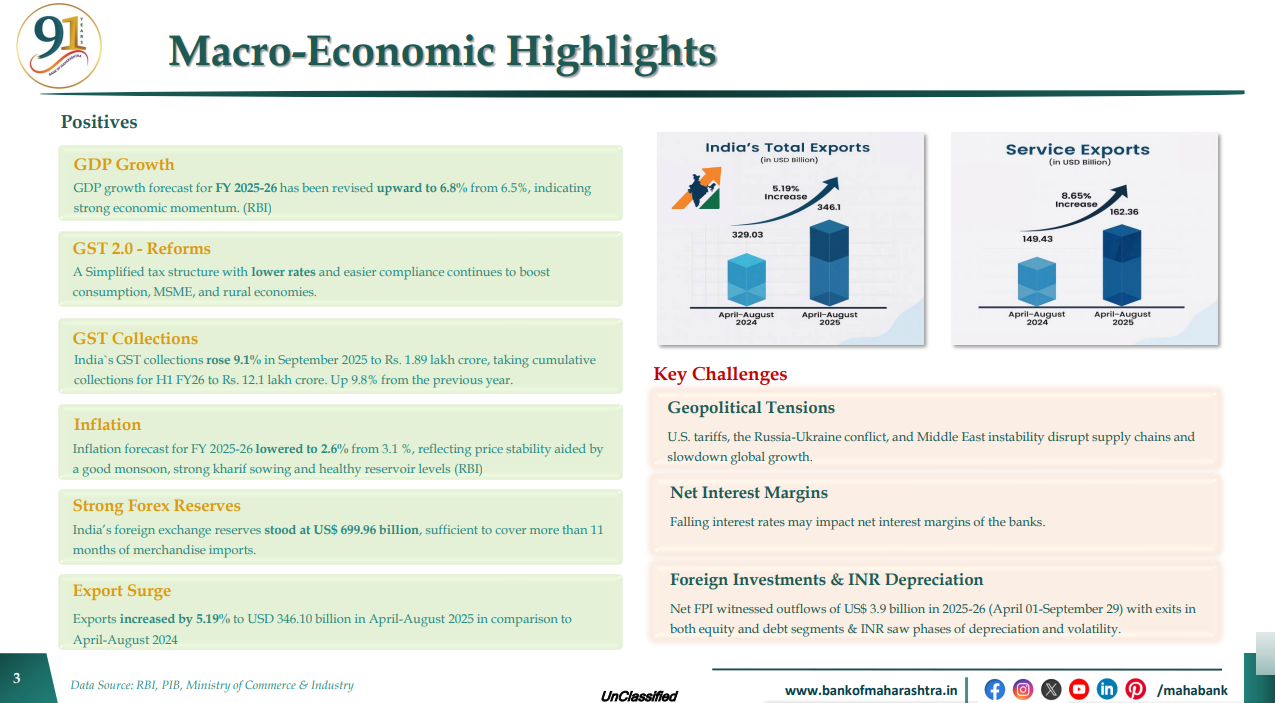
India’s macro-economic story has two sides. On the positive front, GDP growth has been revised upward to 6.8%, GST collections are up 9.1% to ₹12.1 lakh crore, inflation has cooled to 2.6%, and forex reserves stand strong at $699.96 billion. Total exports jumped 5.19% to $346.10 billion, with service exports growing even faster at 8.65%. However, challenges remain: geopolitical tensions are disrupting supply chains, falling interest rates may squeeze banks’ net interest margins, and foreign investors pulled out $3.9 billion in the first half of FY 2025-26, with the rupee facing depreciation pressure.
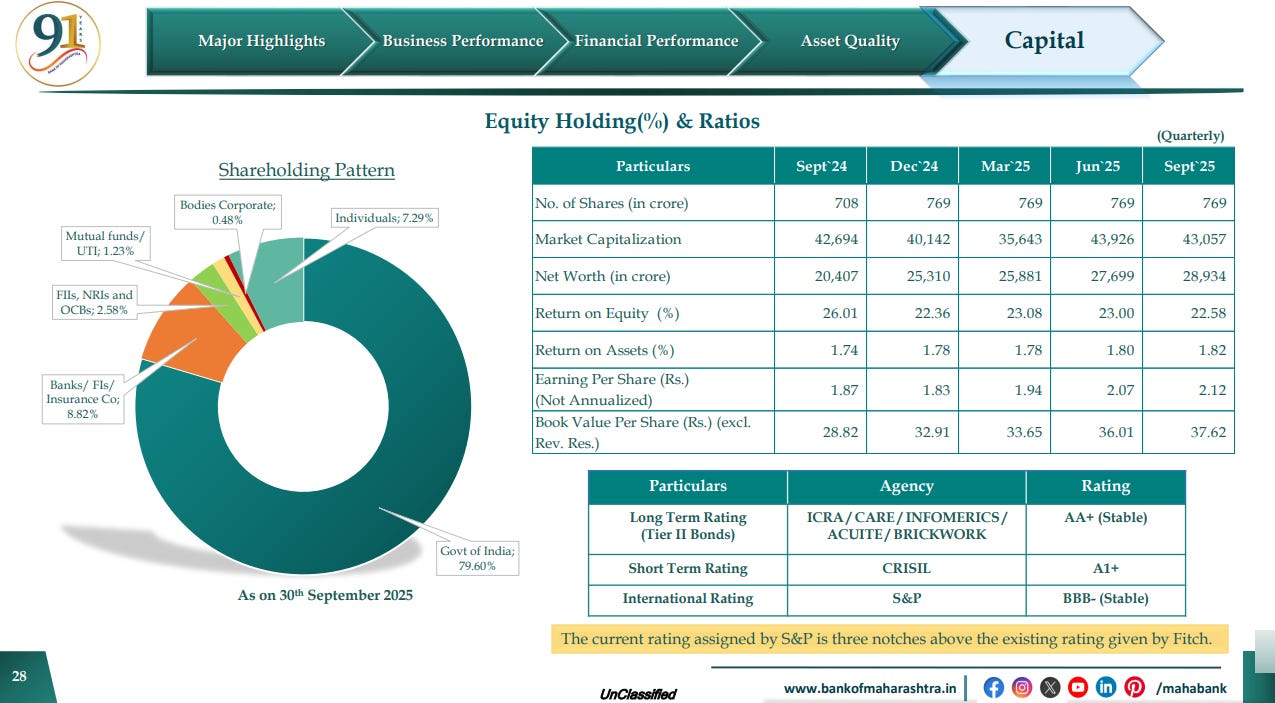
Government continues to hold nearly 80% of the UCO Bank’s shares, while institutional investors like banks, FIs, and insurance companies account for about 9%. On the performance side, the bank’s market cap stands at ₹43,057 crore, with a net worth of ₹28,934 crore. Return on equity is at 22.58%, while return on assets is a modest 1.82%, and earnings per share have grown to ₹2.12. The bank holds solid credit ratings—AA+ (Stable) for long-term bonds, A1+ for short-term instruments, and BBB- (Stable) from S&P internationally, which is three notches above Fitch’s rating.
Real Estate
Sobha | Small Cap | Real Estate
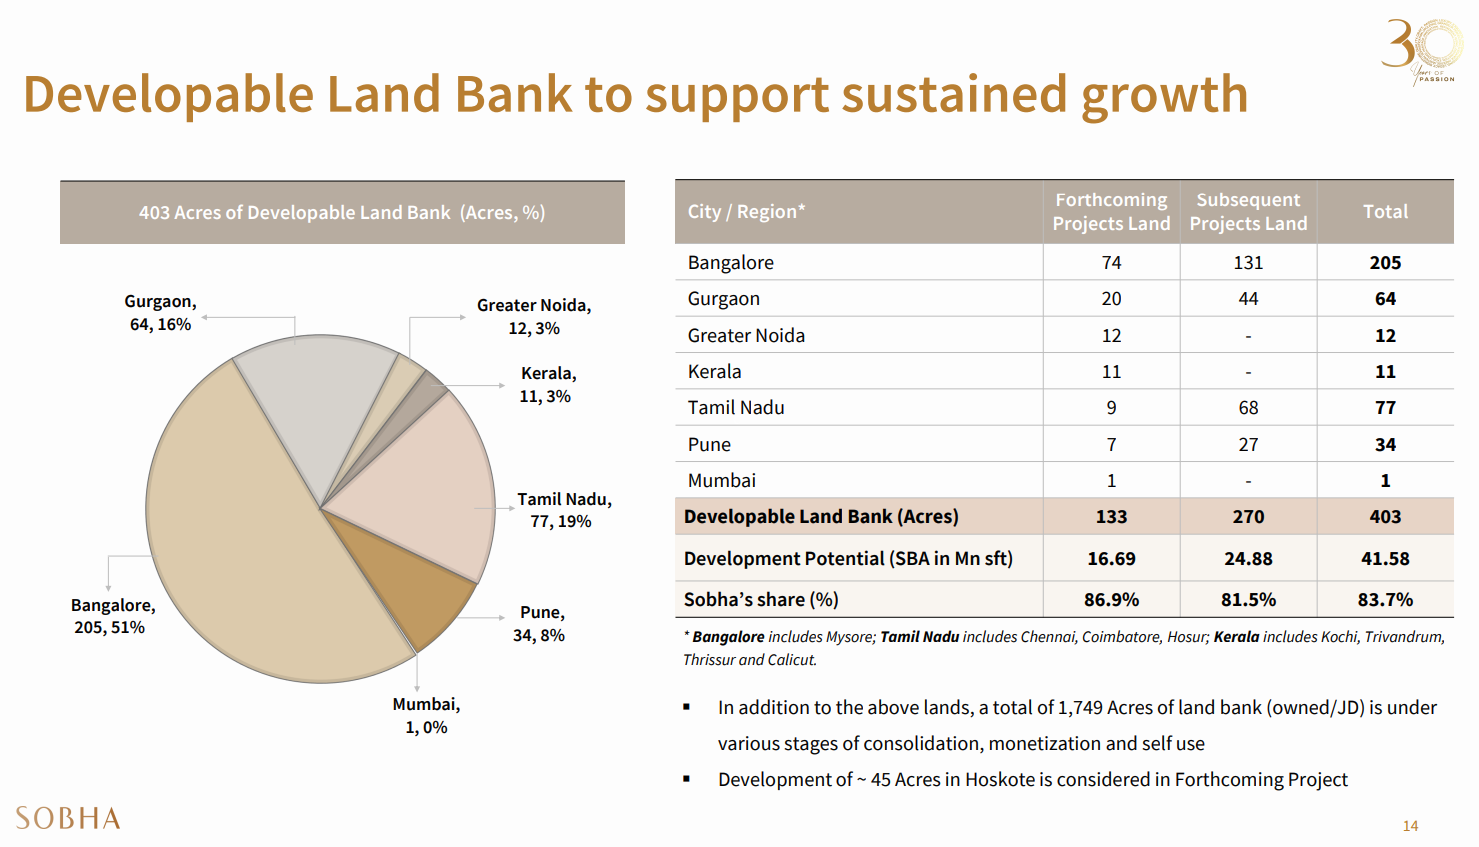
Sobha Limited holds 403 acres of developable land spread across key cities, with over half of it—205 acres or 51%—located in Bangalore. The land bank has a total development potential of 41.58 million square feet, with Sobha owning an 83.7% share in these projects. Out of this, 133 acres are earmarked for forthcoming projects and 270 acres for subsequent ones. Beyond this, another 1,749 acres are in various stages of consolidation, monetization, or self-use, with a 45-acre development in Hoskote also lined up as a forthcoming project.
That’s it for now! Your feedback will really help shape how Points and Figures evolves. Drop it down in the comments below!
Quotes in this newsletter were curated by Meher & Vignesh.
Disclaimer: We’ve used AI tools in filtering and cleaning up the quotes from the images so there maybe some mistakes. Now, if you are thinking why we are using AI, please remember that we are just a small team of 5 people running everything you see on Zerodha Markets 😬 So, all the good stuff is human and mistakes are AI.
We’re now on Reddit!
We love engaging with the perspectives of readers like you. So we asked ourselves - why not make a proper free-for-all forum where people can engage with us and each other? And what’s a better, nerdier place to do that than Reddit?
So, do join us on the subreddit, chat all things markets and finance, tell us what you like about our content and where we can improve! Here’s the link — alternatively, you can search r/marketsbyzerodha on Reddit.
See you there!
We started a new experiment - Plotlines?
Plotlines is an extension of our Chatter newsletter. While most financial analysis focuses on quarterly results and near-term changes, Plotlines takes a different approach. We analyze executive commentary from earnings calls and investor presentations to identify long-term, structural shifts that will shape industries for years to come.
Instead of chasing headlines, we look for strategic pivots, evolving competitive dynamics, and fundamental changes in how companies allocate capital. Each week, we’ll highlight the most significant “plotlines” from recent corporate communications, focusing on comments that signal permanent changes in market structure, technology adoption, or business models.
Points and Figures is run by the same team that creates The Daily Brief and Aftermarket Report.
Seemed like an abridged and sharper version, which is good! Thanks for the excellent work!